
Fig. 1.
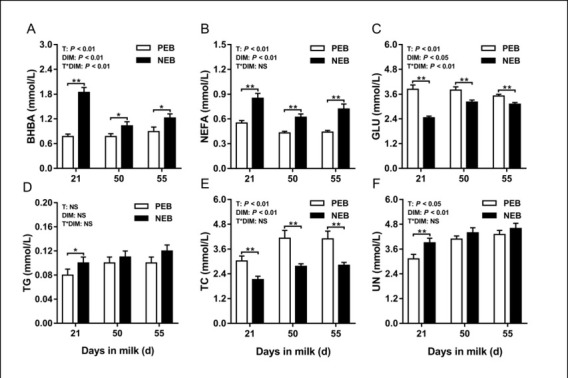
Least squares mean (± SEM) concentrations of plasma β-hydroxybutyric acid, non-esterified fatty acids, glucose, triglycerides, total cholesterol, and urea nitrogen at 21, 50, and 55 d after calving for positive energy balance (PEB) (n = 15) and negative energy balance (NEB) (n = 15) dairy cows
T – treatment group; DIM – days in milk; T × DIM – interaction between treatment group and days in milk