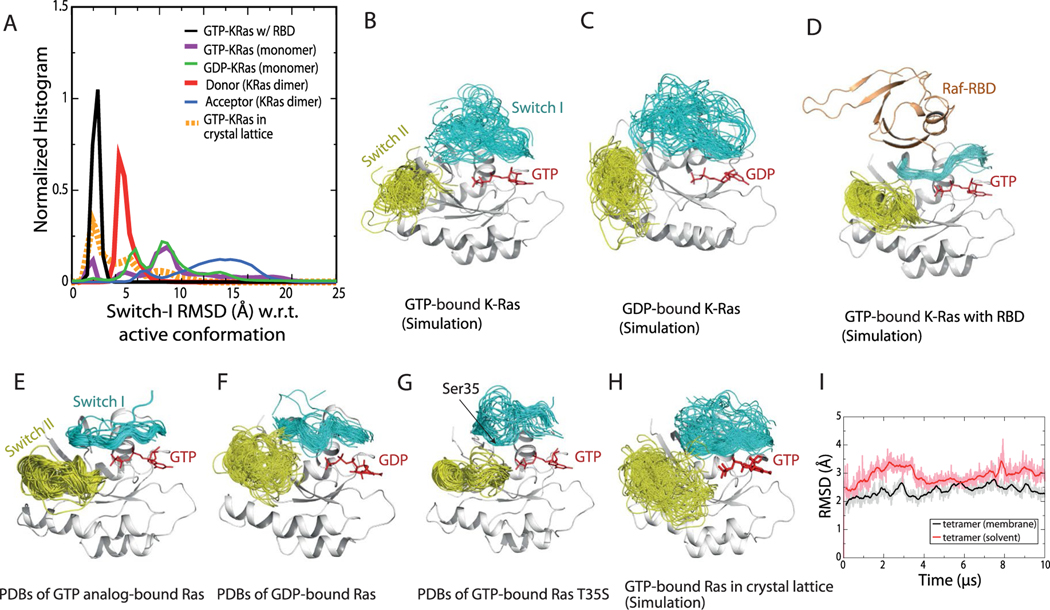
Extended Data Fig. 3 |. Stability of the active switch i and switch ii conformations.
a. Distributions of the switch I conformation of K-Ras in various simulations. Normalized histograms of the switch I backbone root-mean-square deviation (RMSD) with respect to the active switch I conformation in PDB 4DSN are shown. b. Conformations of the switch I (residues 30–38, cyan) and switch II (residue 60–76, yellow) regions in simulations of the GTP-bound K-Ras monomer. c. Conformations of the switch I and II regions in simulations of GDP-bound K-Ras monomer. d. Conformations of the switch I and II regions in simulations of GTP-bound K-Ras bound with C-Raf RBD. e. Crystal structures of Ras bound with GTP or GTP analogs, with the switch I and switch II regions highlighted. The PDB entries included are 1AGP, 1CLU, 1CTQ, 1GNP, 1GNR, 1HE8, 1JAH, 1JAI, 1K8R, 1LF0, 1LFD, 1NVU, 1NVV, 1NVW, 1NVX, 1P2S, 1P2T, 1P2U, 1P2V, 1PLJ, 1PLK, 1QRA, 1RVD, 1ZW6, 2C5L, 2RGA, 2RGB, 2RGC, 2RGD, 2RGE, 2RGG, 2UZI, 2VH5, 3DDC, 3GFT, 3I3S, 3K8Y, 3L8Y, 3L8Z, 3LBH, 3LBI, 3LBN, 3OIU, 3OIV, 3OIW, 3RRY, 3RRZ, 3RS0, 3RS2, 3RS3, 3RS4, 3RS5, 3RS7, 3RSO, 3TGP, 3V4F, 4DLR, 4DLS, 4DLT, 4DLU, 4DLV, 4DLW, 4DLX, 4DLY, 4DLZ, 4DSN, 4DSO, 4DST, 4EFL, 4EFM, 4EFN, 4G0N, 4G3X, 4K81, 4L9W, 4NMM, 4NYI, 4NYJ, 4NYM, 4RSG, 4XVQ, 4XVR, 5B2Z, 5B30, 5P21, 6Q21, 121 P, 421 P, 521 P, 621 P, 721 P, 821 P, and 221 P. f. Crystal structures of Ras loaded with GDP. The PDB entries included are 1AA9, 1CRP, 1CRQ, 1CRR, 3LO5, 1IOZ, 1LF5, 1PLL, 1Q21, 1WQ1, 1XD2, 1XJ0, 1ZVQ, 2CE2, 2CLD, 2Q21, 2QUZ, 2X1V, 3CON, 3KUD, 4DSU, 4EPR, 4EPT, 4EPV, 4EPW, 4EPX, 3EPY, 4L8G, 4L9S, 4LDJ, 4LPK, 4LRW, 4LUC, 4LV6, 4LYF, 4LYH, 4LYJ, 4M1O, 4M1S, 4M1T, 4M1W, 4M1Y, 4M21, 4M22, 4OBE, 4PZY, 4PZZ, 4Q01, 4Q02, 4Q03, 4Q21, 4QL3, 4TQ9, 4TQA, 4WA7, and 5F2E. g. Crystal structures of the T35S Ras mutant loaded with GTP or GTP analog, with the switch I and switch II regions highlighted. The PDB entries included are 1IAQ, 2LCF, 2LWI, 3KKM, and 3KKN. The hydroxyl of Thr35 in the switch I region in wild-type Ras coordinates the Mg2+ ion bound to the GTP, and the T35S mutation is known to disrupt the switch I active conformation. The switch I inactive conformations sampled by the simulations (Supplementary Fig. 3B and C) are broadly consistent with the inactive conformations in T35S structures116. h. Conformations of the switch I and II regions in simulations of 24 copies of GTP-bound K-Ras in a crystal lattice (of PDB 3GFT). i. The Cα atom RMSDs of a GMA K-Ras tetramer (w.r.t. the starting structure) in a 10-μs simulation with membrane and in a 10-μs simulation in water solvent. As shown, the membrane helps stabilize the tetramer structure.

