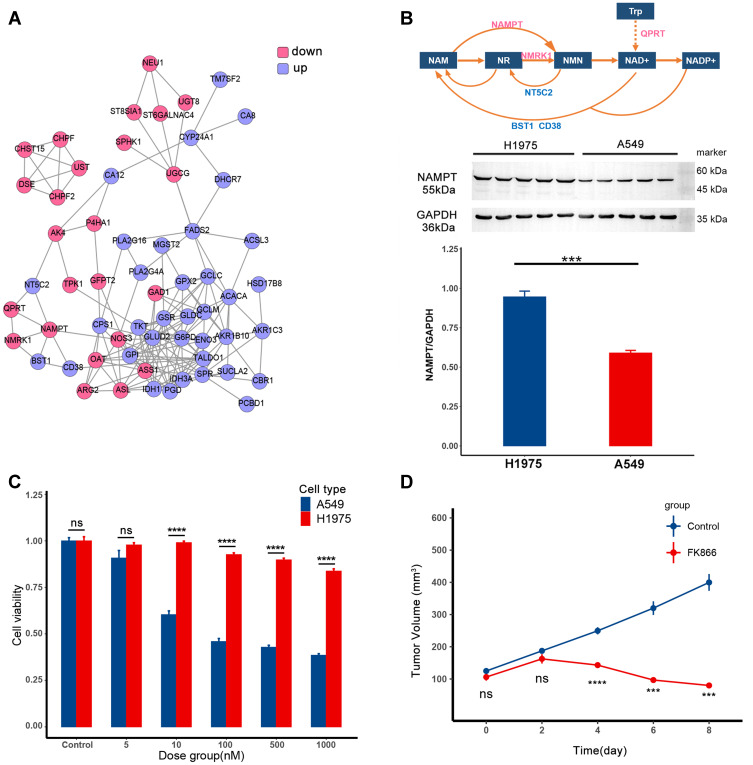
Figure 1.
FK866 selectively inhibits the proliferation of A549. (A) The protein–protein interaction (PPI) of differentially expressed genes (DEGs) between H1975 and A549. The protein in the pink circle was less expressed in A549 than in H1975, and protein in the blue circle was more expressed in A549. (B) The top is the metabolic pathway of NAD+. The text in the box represents metabolite, and the text around the arrow represents metabolic enzyme. The middle part is expression level of NAMPT in H1975 and A549, the corresponding quantitative result is in the bar plot at the bottom (p-value=0.001, ***p < 0.005). (C) The efficacy of FK866 in vitro. H1975 and A549 were cultured in different concentrations of FK866 for 72h. The cell viability comparison of H1975 and A549 in the same dose group was calculated by t-test. The significant difference started from 10 nM (p < 0.0001: ****ns: not significant). (D) The efficacy of FK866 in vivo. Mice inoculated with A549 were given FK866 (20 mg/kg/day) or vehicle for eight days. The tumor volume at the same time point was compared by t-test in these two groups, and the significant difference started from the fourth day (p < 0.005: ***p < 0.0001: ****ns: not significant).

