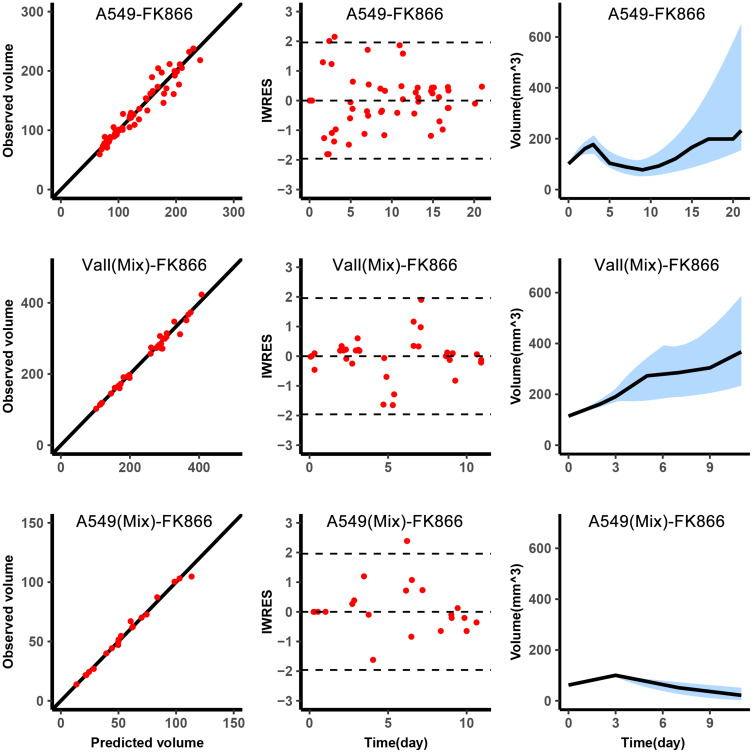
Figure 2.
Graphical diagnostics of the model. Observations versus individual predictions for A549 in single with FK866 from day 0 to day 8 (top, n=5), the total volume of the mixed tumor with FK866 from day 3 to day 11 (middle, n=5), A549 in mixed tumor (bottom, n=5). Each row includes lines of identity (left), individual-weighted residuals (IWRES) versus time (middle), and the predicted volume versus time (right). In the subplots of predicted volume versus time, the blue shaded area represents the 90% confidence interval of the simulation of the median value of the experimental samples. The line represents the median of the observations.

