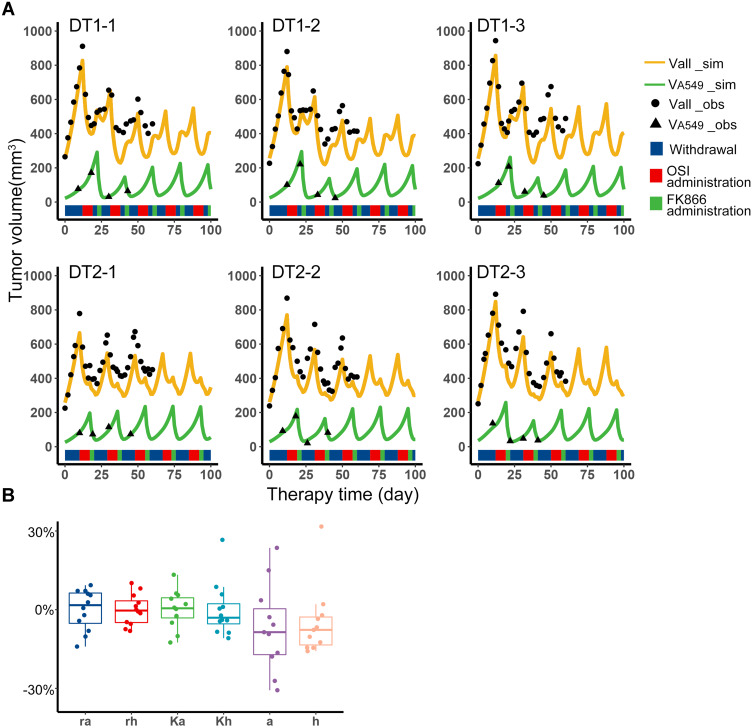
Figure 3.
Fixed periodic treatment plan implemented in animal experiment. (A) Tumor volume versus therapy time in the experiment. The first row was the three representative samples from the DT1 group, which adopted the O-W-F-W plan. The second row was the three representative samples from the DT2 group which adopted the O-F-W plan. The black dots were the observations of total volume, and the black triangle was the observations of A549 volume. The experiment has been performed for 60 days, so the observations were collected to the 60th day. The yellow curves were the simulation results of total volume, and the green curves were the simulation results of A549 volume. The blue, red and green color bands below the curves represent the withdrawal, administration of osimertinib and FK866, respectively. (B) Distribution of individual parameters of experiment samples. Boxplot of biological parameters of experiment samples obtained from individual empirical Bayes estimates.

