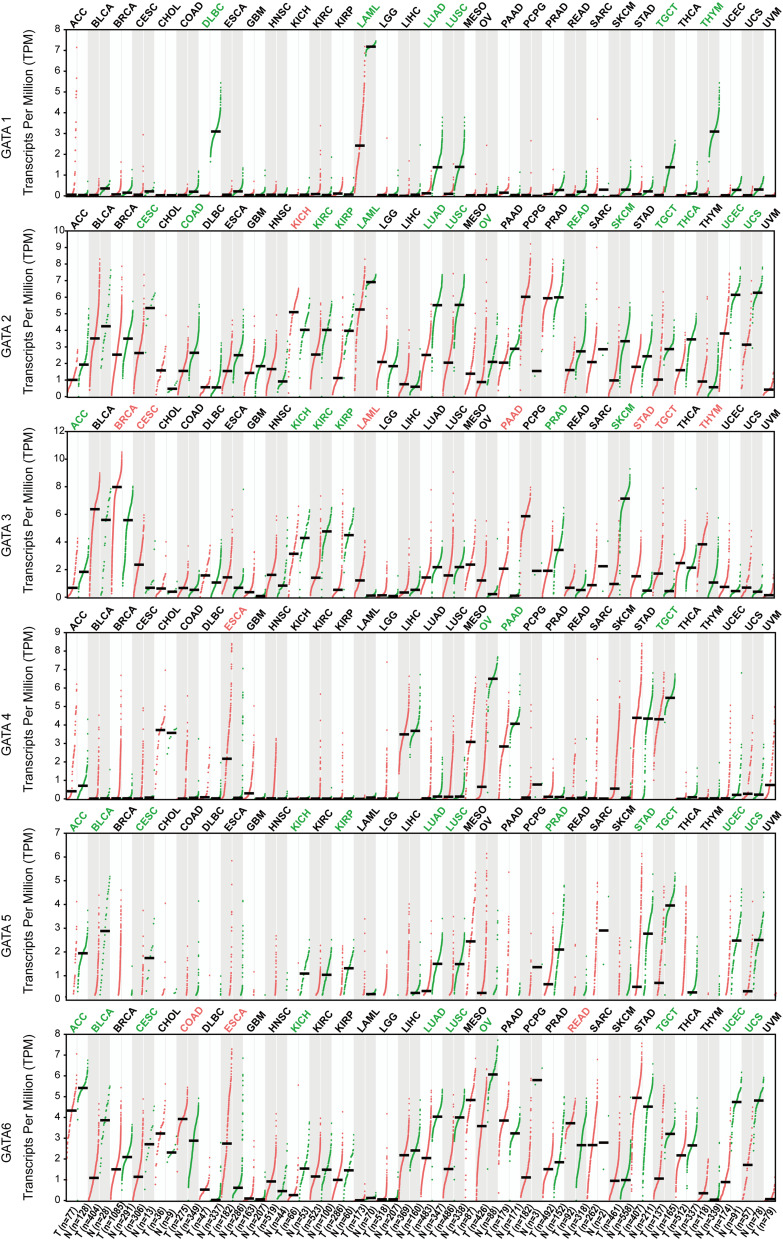
Figure 3.
The mRNA expression levels of the GATA family members in TCGA pan-cancer data compared with GTEx normal tissue according to the GEPIA2 database. The red tumor type label represented significant up-regulation of mRNA expression, green represented down-regulation, and black represented no statistically significant differences. The p-value was defined as 0.05.

