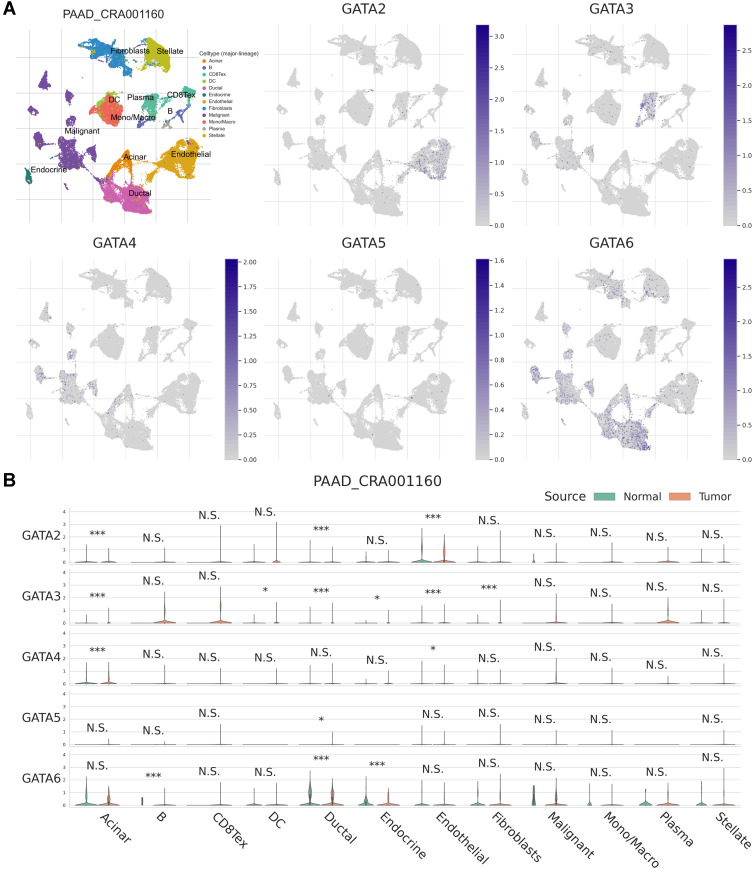
Figure 12.
The expression of GATA family members in PAAD_CRA001160 at single-cell resolution. (A) The localization of GATA family members in the tumor microenvironment of pancreatic cancer. (B) The comparison of GATA family members’ expression between normal pancreas and pancreatic cancer samples across cell types. The significance of the difference between the two groups in each cell type is evaluated through the Mann–Whitney U-test and adjusted through Benjamini–Hochberg correction. “N.S.” represents q > 0.05; “*” represents 0.01 < q ≤ 0.05; “***” represents q ≤ 0.001.

