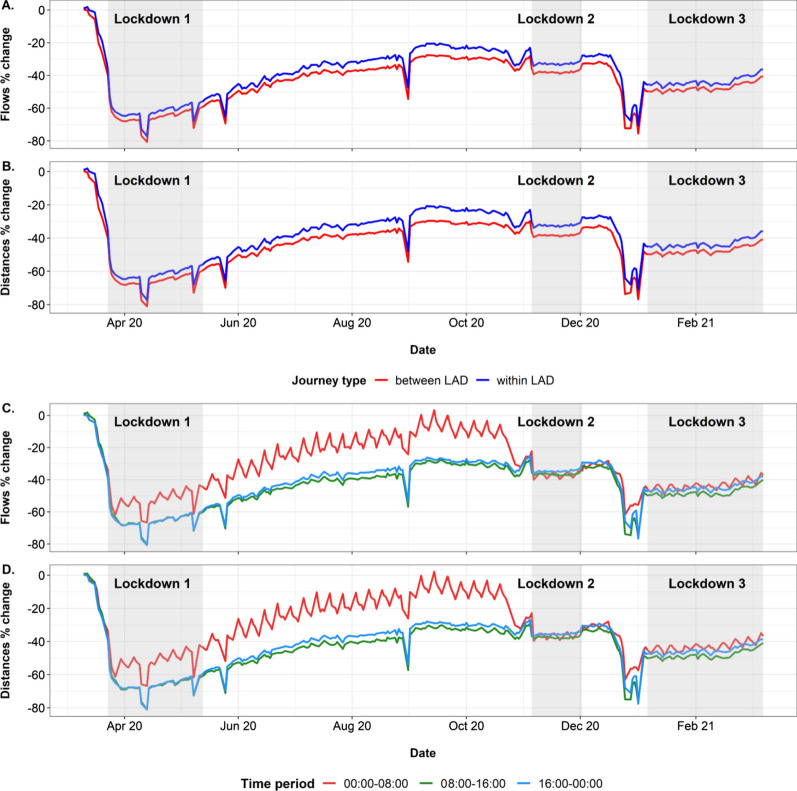
Fig. 2.
Percentage changes in A, C daily movement (flows) of Facebook users and B, D total distance travelled on weekdays between March 10th 2020 and March 9th 2021. A, B show the changes corresponding to different journey types (between and within UK local authority districts). C, D show the changes corresponding to all journeys across adjacent 8 h time periods. Time period shown represents the second time period, where the journey ends. The change is relative to a pre-COVID baseline (see Methods for details). See Additional file 3: Fig. S4 for changes to weekend flows and distances

