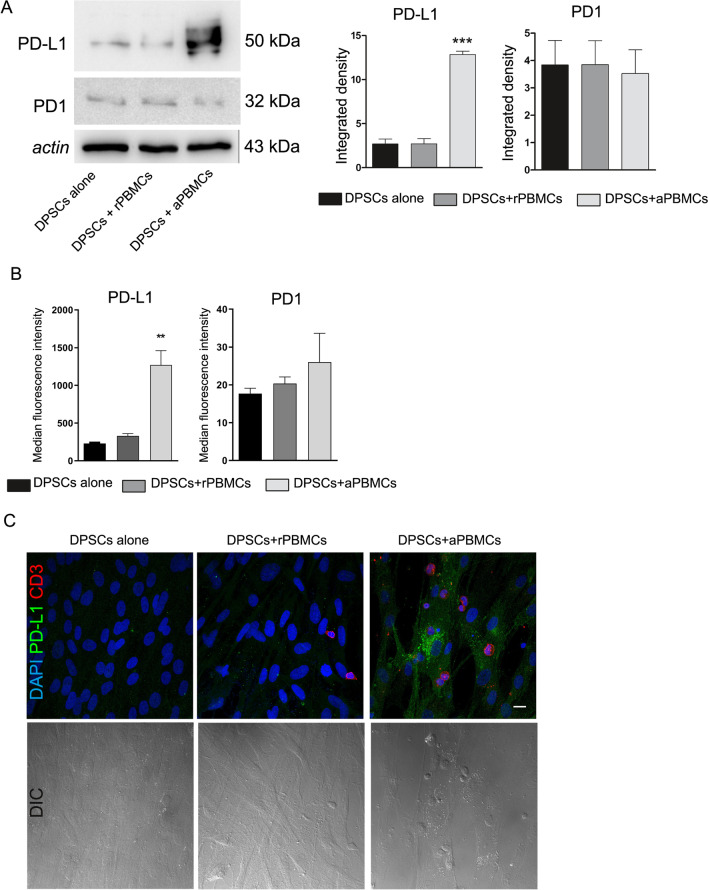
Fig. 2.
Immunomodulatory properties of DPSCs. A Western blot analyses performed on DPSCs alone and after direct co-culture with rPBMCs and aPBMCs for PD-L1 and PD1. Histograms show that DPSCs after co-culture with aPBMCs are able to express statistically significant higher levels of PD-L1. ***P < 0.001 versus DPSCs alone and versus DPSCs + rPBMCs. Data are expressed as mean ± SD and analyzed by one-way ANOVA followed by Newman-Keuls post-hoc test. B Expression of PD1 and PD-L1 was evaluated by flow cytometry on DPSCs cultured alone, co-cultured with rPBMCs and with aPBMCs. Median fluorescence intensity obtained by PD1 and PD-L1 staining minus median fluorescence intensity in FITC and PECy7 channels of FMO controls is shown. Data are represented as mean ± SD and analyzed by one-way ANOVA with Tukey post-hoc test. C Immunofluorescence analysis performed on DPSCs alone and in direct co-culture with rPBMCs and aPBMCs. DPSCs in co-culture with aPBMCs (red CD3+) are able to express PD-L1. DIC images on the bottom highlight the cell morphology and the co-culture system setup. Nuclei were counterstained with DAPI. Scale bar: 10 µm

