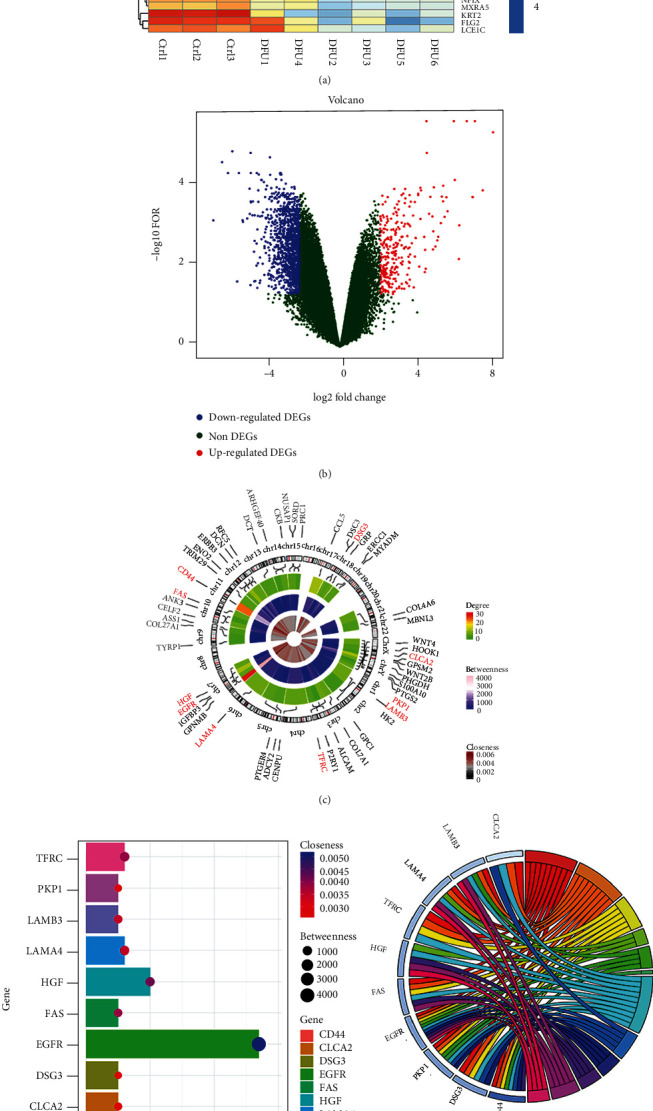
Figure 1.

EGFR expression is decreased in DFUs. (a) Hierarchical clustering heat map constructed using GSE80178 data. (b) Volcano plot based on GSE80178 data. (c) Degree centrality analysis of the top 50 degree-filtered genes from the DEG PPI network and corresponding chromosomal positions. The top 10 hub genes are highlighted in red. (d) Distribution of degree, betweenness, and closeness of the top 10 hub genes. (e) Enrichment analysis findings for the top 10 genes in the PPI network. (f) Expression of EGFR in skin tissues from non-DFU (n = 6) and DFU patients (n = 6) measured using qRT-PCR analysis.
