Figure 1.

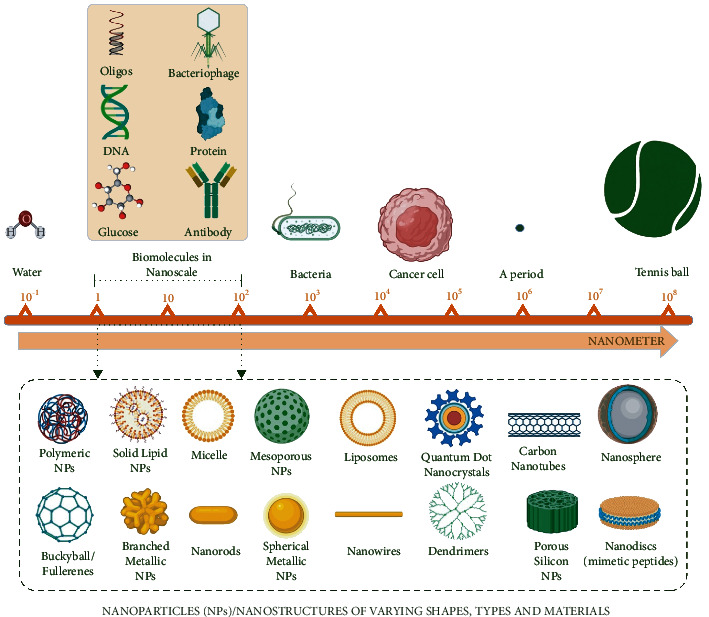
Schematic diagram exhibiting size comparison of nanoparticles (NPs) typically in the range of 1–100 nm, as compared to the other structures. Created with BioRender.com with publication license.

Schematic diagram exhibiting size comparison of nanoparticles (NPs) typically in the range of 1–100 nm, as compared to the other structures. Created with BioRender.com with publication license.