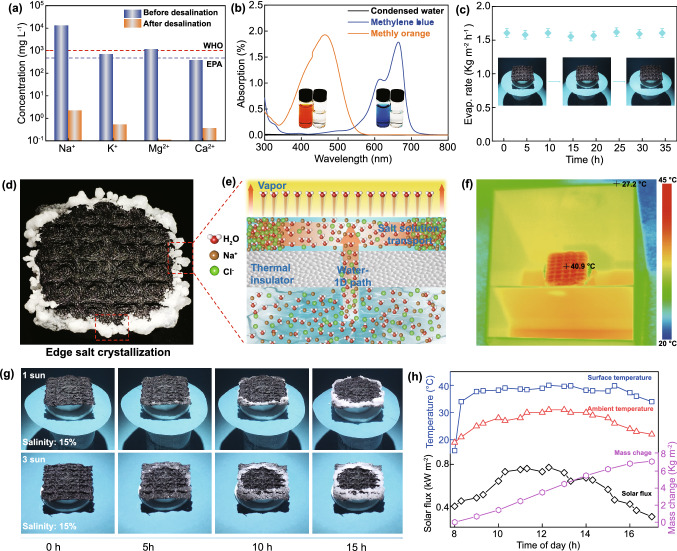
Fig. 5.
a Concentrations of major cations in real seawater (Yellow Sea, China) before and after desalination. b UV–vis absorption spectra of methylene blue (MB) and methyl orange (MO) solutions before evaporation and the corresponding condensed water after evaporation. c Comparison diagram of a honeycomb fabric-based evaporator before and after 35 h of continuous evaporation. d Digital image of salt accumulation at the edge of the evaporator. e Schematic diagram of water evaporation, water transport, and salt accumulation in a solar steam generator. f IR image of the solar after 20 min of solar irradiation. g Digital image of salt accumulation under the irradiation of 1 and 3 solar intensities with salt concentration of 15%. h Variations in solar intensity, honeycomb fabric surface temperature, ambient temperature, and evaporation mass with time from 8:00 to 17:00 (Nov. 12, 2020; Qingdao, China)

