Fig. 3.
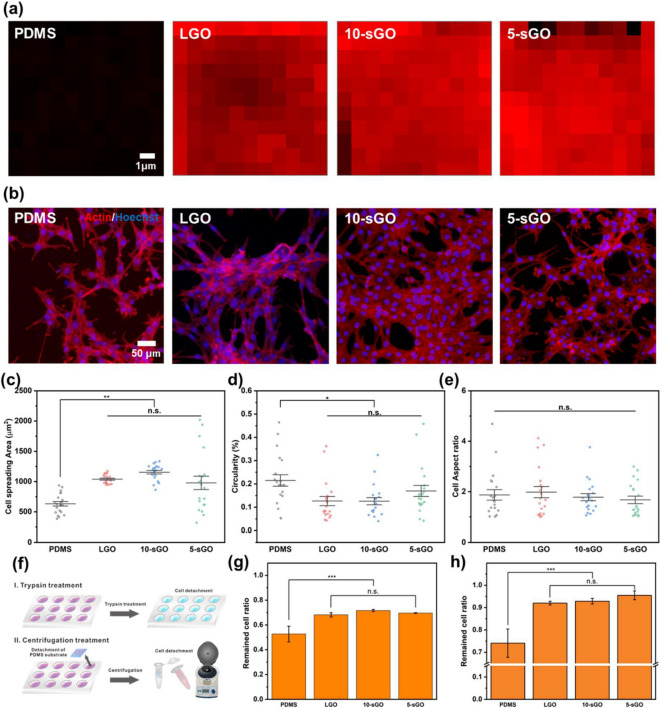
Confirmation of the effect of graphene oxide on cell behaviors. a FE-SEM images of PR nanohole patterns and PDMS nanopillar patterns, and b size distribution of PDMS patterns. Raman intensity map of the bare PDMS, LGO-, 10-sGO-, and 5-sGO-modified PDMS. b Confocal microscope images of the cells on bare PDMS, LGO-, 10-sGO-, and 5-sGO-modified PDMS immunostained with actin (Red) and Hoechst (Blue). c−e Cell spreading area (c), circularity (d), and cell aspect ratio (e) of the cells on bare PDMS, LGO-, 10-sGO-, and 5-sGO-modified PDMS. f Schematic diagram of trypsin and centrifugation treatment process. g, h Cell ratio remaining on the PDMS, LGO-, 10-sGO-, and 5-sGO-modified PDMS after trypsin (g) and centrifugation (h) treatment. (* p ≤ 0.5, ** p ≤ 0.01, *** p ≤ 0.001)

