Fig. 5.
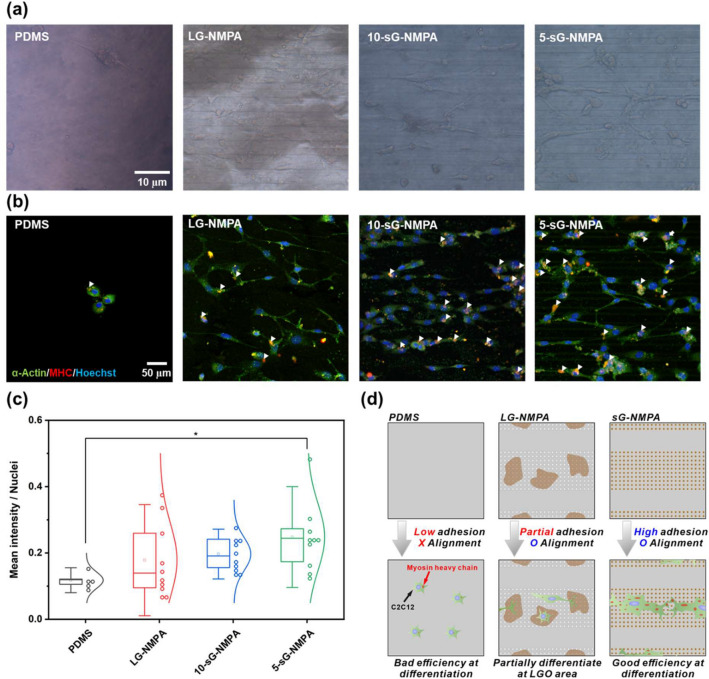
Confirmation of myogenic differentiation of the cells. a Brightfield images of the cells on the bare PDMS, LG-NMPA, 10-sG-NMPA, and 5-sGO-NMPA. b Confocal microscope images of the cells on bare PDMS, LG-NMPA, 10-sG-NMPA, and 5-sGO-NMPA immunostained with α-actin (Green), MHC (Red), and Hoechst (Blue). c The graph for mean intensity divided by number of nuclei. d Schematic diagram of the correlation between GO size and cell differentiation based on the mean intensity data. (* p ≤ 0.5)

