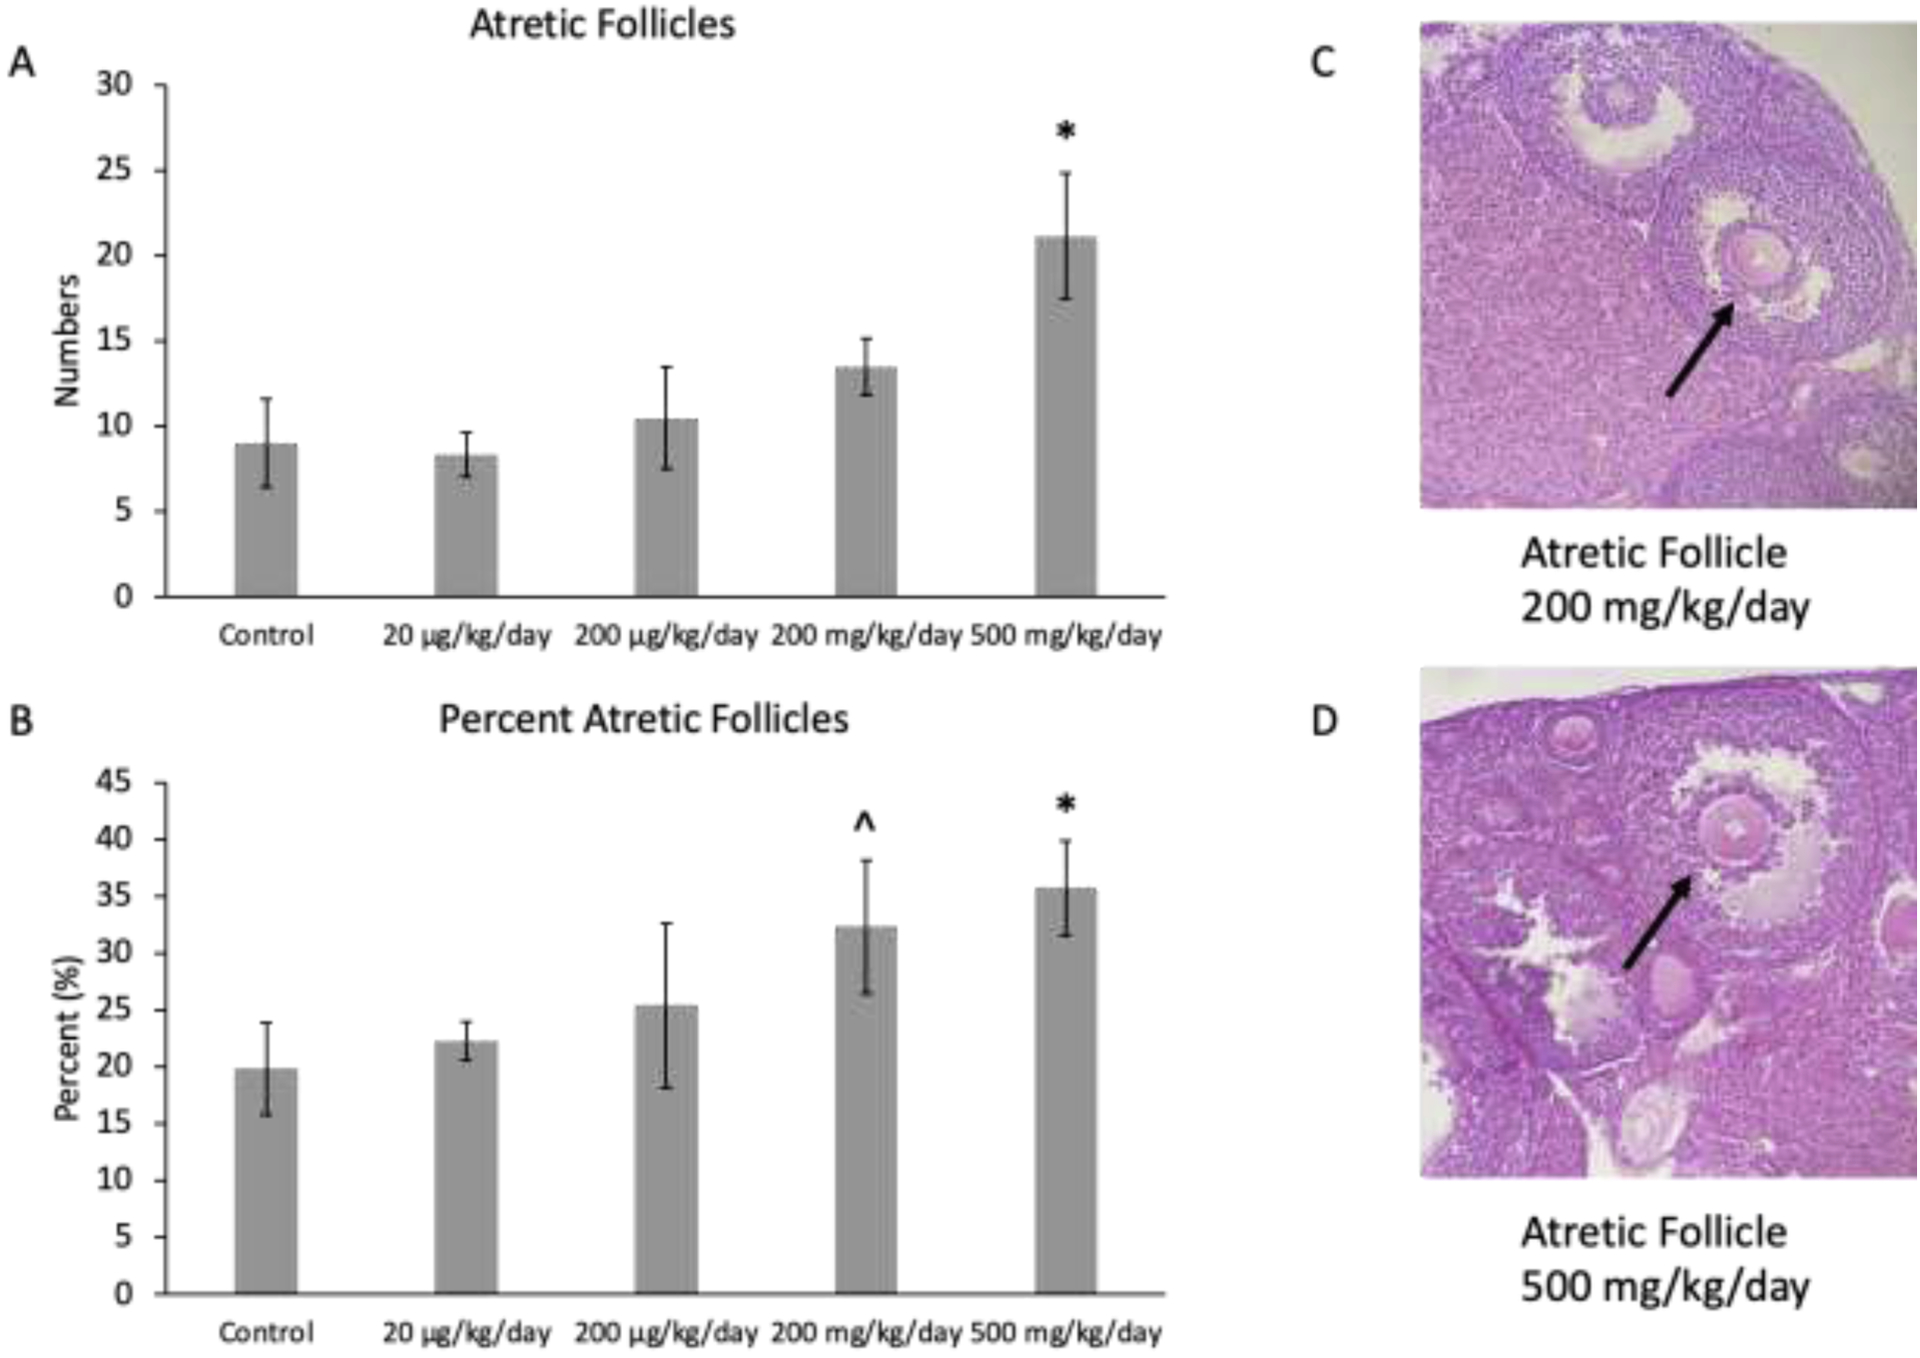
Figure 5.

Mean follicle counts and percent of follicles for atretic follicles in F1 adult female mice at PND 60. The values for each treatment group are compared to the control, with the asterisk symbol (*) indicating significance in comparison to the control (p ≤ 0.05) and the caret symbol (^) indicating borderline significance in comparison to the control (p ≤ 0.10). The data are presented as means ± standard error of the mean from 6 females per treatment group and follicle type. A. F1 mean atretic follicle counts (n=6 mice/treatment group) B. F1 percent atretic follicles (n=6 mice/treatment group) C. Atretic follicle in ovary exposed to mixture at 200 mg/kg/day D. Atretic follicle in ovary exposed to mixture at 500 mg/kg/day. Black arrows indicate apoptotic bodies.
