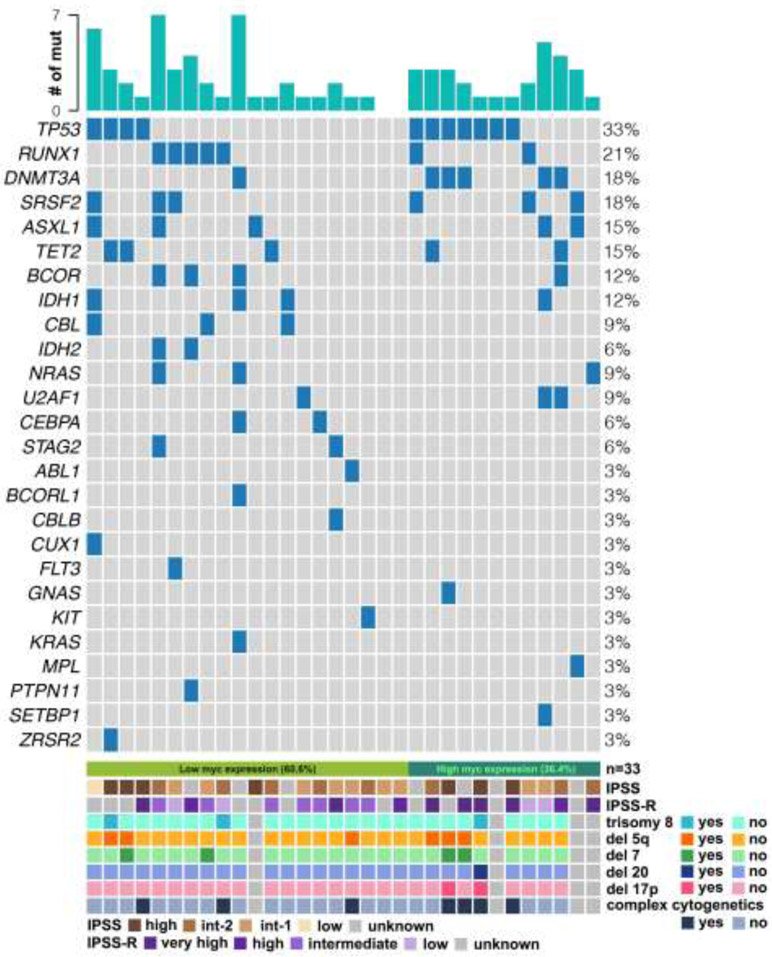
Figure 2. Somatic mutations and cytogenetics in low vs. high MYC patients.
Individual column represents somatic mutations from individual patient at the time of MDS progression to AML. Each row represents the presence of individual somatic mutation in the patient cohort. Name of each gene and % of each mutation are described on the left and right side, respectively. IPSS, IPSS-R and concurrent cytogenetics (trisomy 8, deletion 5q, deletion 7, deletion 20, deletion 17p, and complex karyotype) are shown at the bottom plot.

