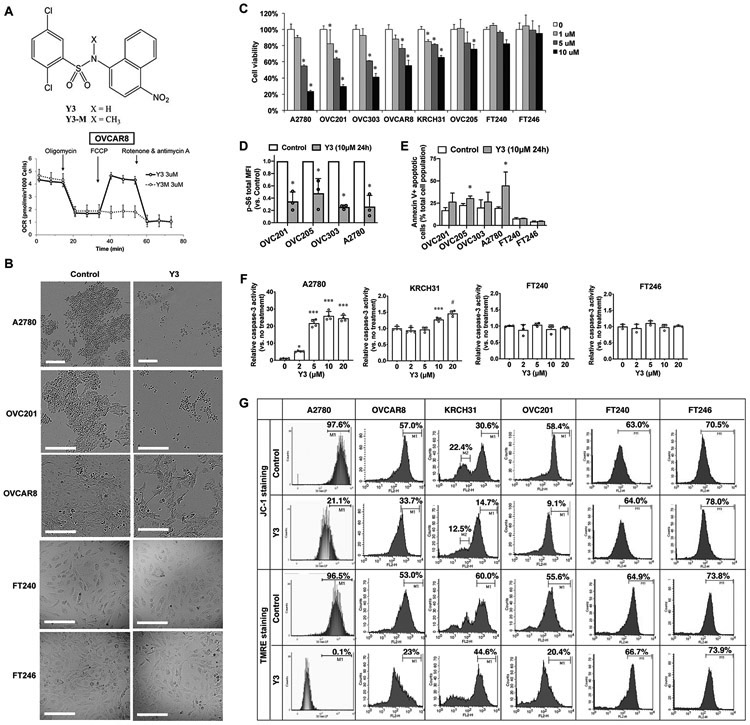
Figure. 1. Y3 induces apoptosis and inhibits proliferation of EOC cells.

A, Chemical structure of Y3/Y3-M and the oxygen consumption rate (OCR) of OVCAR8 cells. The final concentration of Y3 or Y3-M was 3μM. B, Morphology of 10 μM Y3-treated and untreated EOC cell lines. Scale bar = 200 μm. C, Cell viability of Y3 treated cells. Two-way ANOVA followed by Sidak HSD test, n=5, *P<0.005. D, p-S6 flow cytometry analysis. Cancer cells were treated with 10 μM Y3 for 24 hs. MFI, median fluorescence intensity. Two-way ANOVA followed by Sidak HSD test, n=3, *P<0.05. E, AnnexinV-FITC/PI flow cytometry analysis. Cancer cells were treated with 10 μM Y3 for 24 h. Two-way ANOVA followed by Sidak HSD test, n=3, * P<0.05. The connecting lines indicate the paired data points that were generated from one experiment. F, Caspase-3 activity of EOC cell lines treated with 10 μM Y3 for 48 h. One-way ANOVA followed by Tukey’s HSD test, n=4, *P<0.05, ***p<0.0005, and #p<0.0001. G, Histograms of flow cytometry analysis in EOC cell lines stained with JC-1 or TMRE. The staining-positive cell populations were labeled with marker 1 (M1).
