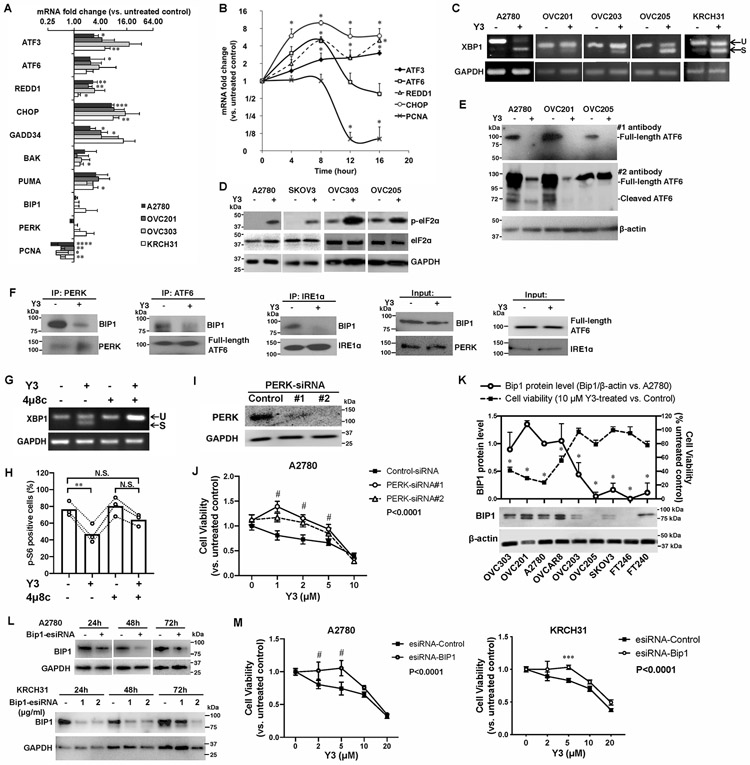
Figure 2. Y3 treatment induces UPR in EOC cells.

A, RT-QPCR of UPR genes in EOC cell lines. Cells were treated with 10 μM Y3 for 24 h. GAPDH was used as a house-keeping gene. Two-way ANOVA followed by Sidak HSD test, n=3, *P<0.05, **P<0.005, ***P<0.0005, ****P<0.0001. B, RT-QPCR of UPR target genes in A2780 cells at different time points of Y3 treatment. A2780 cells were treated with 10 μM Y3. Two-way ANOVA followed by Sidak HSD test, n=3, *P<0.05. C, XBP1 mRNA splicing analyzed by RT-PCR and agarose gel. EOC cells were treated by 10 μM Y3 for 24 h. U, unspliced. S, spliced. D, Y3 treatment (10 μM, 24h) induces eIF2a phosphorylation. GAPDH was used as a loading control. E, Y3 treatment (10 μM, 24h) induces ATF6 cleavage. β-actin was used as a loading control. F, Co-IP of BIP1, PERK, ATF6, and IRE1α. A2780 cells were treated with 10 μM Y3 for 6 h. G, XBP1 mRNA splicing analyzed by RT-PCR and agarose gel. 4μ8c inhibits Y3-induced XBP1 mRNA splicing. A2780 cells are treated by 10 μM Y3 and/or 10 μM 4μ8c for 24 h. H, Flow cytometry analysis of p-S6. A2780 cells are treated by 10 μM Y3 and/or 10 μM 4μ8c for 24 h. Two-way ANOVA followed by Sidak HSD test, n=3, **P<0.005. I, Western blot images of PERK protein knocked down by two siRNAs (#1 and #2). GAPDH was used as a loading control. J, PERK siRNAs inhibit the response of A2780 cells to Y3. Two-way ANOVA followed by Sidak HSD test, n=6, #P<0.0001. K, BIP1 protein level is associated with sensitivity to Y3. Student’s t-test, *P<0.05. β-actin was used as a loading control. L, BIP1-targeting esiRNAs inhibit the expression of BIP1 in A2780 and KRCH31 cells. The negative control esiRNAs target GFP. GAPDH was used as a loading control. M, BIP1-targeting esiRNA inhibits the response of A2780 and KRCH31 cells to Y3. Two-way ANOVA followed by Sidak HSD test, n=6, ***P<0.0005 and #P<0.0001 for comparisons between Y3-treated and untreated groups at the indicated concentrations. P values for the comparisons between the entire control and knockdown groups were indicated in the legend.
