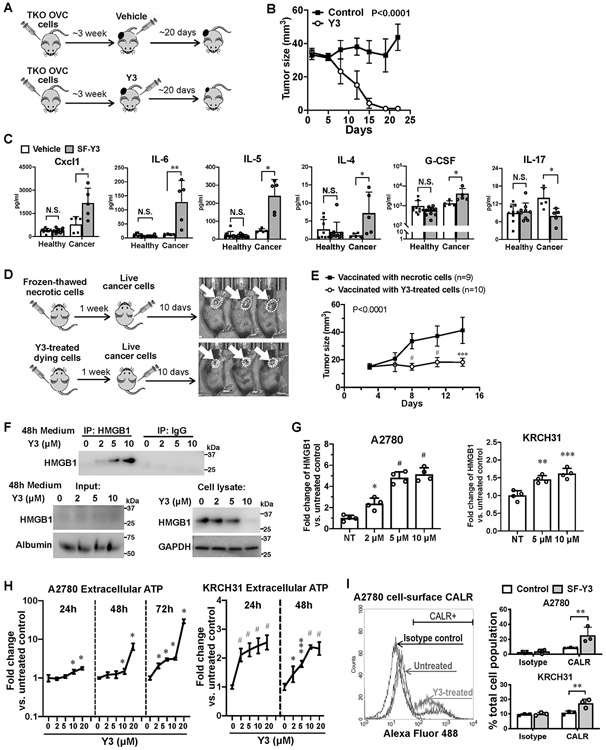
Figure 6. Y3 induces immunogenic cell death in TKO syngeneic mouse EOC model.

A, Flowchart of TKO tumor formation and Y3 treatment. B, Growth curves of tumors formed by TKO mouse ovarian cancer cells in C57BL/6 mice. Two-way ANOVA analysis, n=5. C, Levels of cytokine in mouse plasma samples. Healthy and tumor-bearing mice are both injected with Y3 (5mg/kg, IP once per week) or vehicle. Two-way ANOVA followed by Sidak HSD test, *P<0.05, **P<0.005. D, Flowchart of vaccination assay. Mice in the control group were injected with necrotic TKO cells that were frozen and thawed in liquid nitrogen and at 37°C. The same numbers of TKO cells were treated with 10μM Y3 in vitro for 24 h before they were injected to the left flank of C57BL/6 mice in the test group. One week later, normal live TKO cells were injected to the contralateral flank of all the mice. E, Growth curves of tumors in the right flank of mice. Two-way ANOVA followed by Sidak HSD test, ***P<0.0005, #P<0.0001. F, Immunoprecipitation of HMGB and western blot. A2780 cells are treated with 10 μM Y3 for 48 h. HMGB is precipitated from the culture medium of A2780 cells and detected using anti-HMGB antibody. Albumin was used as a loading control for medium samples. GAPDH was used as a loading control for cell lysate samples. G, HMGB in the culture medium of A2780 cells assessed using ELISA. One-way ANOVA followed by Tukey’s HSD test, *p<0.05, **p<0.005, and #p<0.0001. H, Levels of ATP in cell culture medium of A2780 and KRCH31 cells. Two-way ANOVA followed by Sidak HSD test, n=5, *P<0.05, ***p<0.0005, #p<0.0001. I, Flow cytometry analysis of cell-surface CALR. Cells are treated with 10 μM Y3 for 24 h. Two-way ANOVA followed by Sidak HSD test, n=3, **P<0.005.
