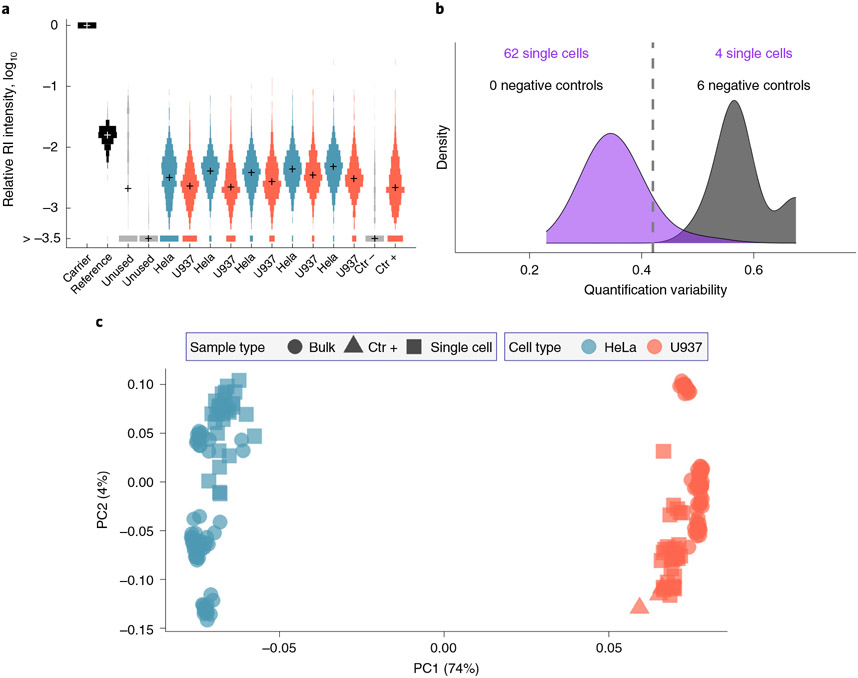
Fig. 4 ∣. Evaluating protein quantification results from SCoPE2 analysis.
a, Distributions of relative reporter ion intensities for all samples from a single SCoPE2 set. The samples include an isobaric carrier, a reference 5 single HeLa cells, five single U937 cells, a negative control well (Ctr−) and a positive control well (Ctr+) from diluted U937 cell lysate. Two of the TMT labels (between the reference and the single cells) are not used because they are affected by isotopic impurities of the TMT labels used for the carrier and the reference. The bin marked by >−3.5 corresponds mostly to RI intensities below the detection limit (missing values). The spread of the single-cell RI distributions corresponds to differences in the relative protein levels among the single cells and the isobaric carrier/reference. b, Distributions of CVs quantify the consistency of protein quantification based on different peptides originating from the same protein. Lower CVs for the single cells correspond to higher consistency of quantification compared with the CVs of the negative control wells, which correspond to noise. c, PCA of 126 single cells and bulk samples. The PCA is based on 1,756 proteins with ~1,000 proteins quantified per single cell. b and c are generated by the SCoPE2 pipeline53.

