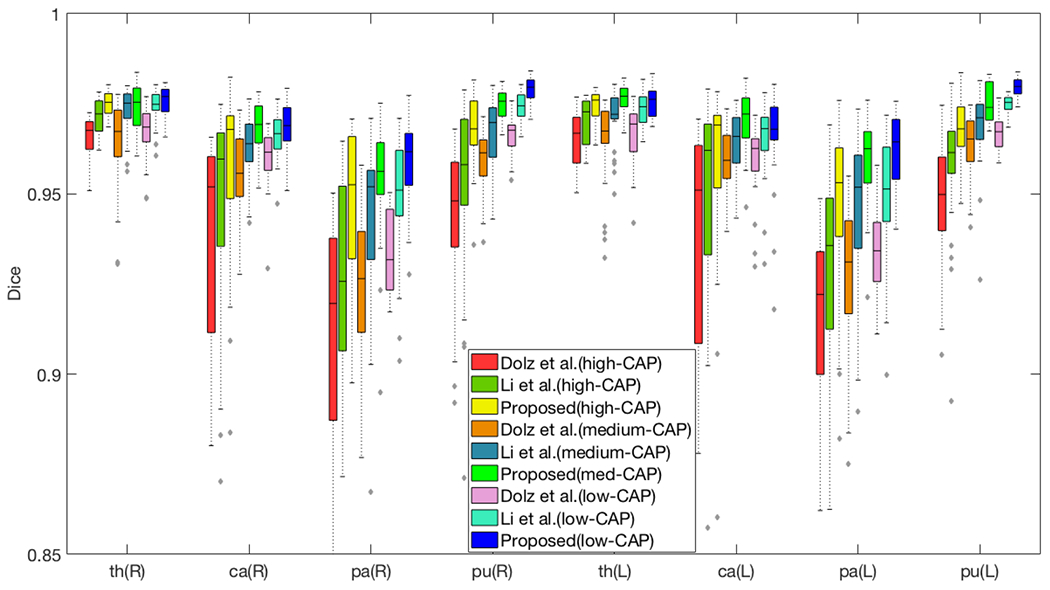
Figure 4.

Segmentation performance of 39 HD pre-manifest subjects (13 subjects in each category). Higher CAP scores indicate patients further along the HD disease progression, and are associated with more atrophy. The horizontal axis lists the (R)ight and (L)eft pairs of thalamus, caudate, pallidum and putamen.
