
Figure 2. Multimodal Prediction Model Fit.
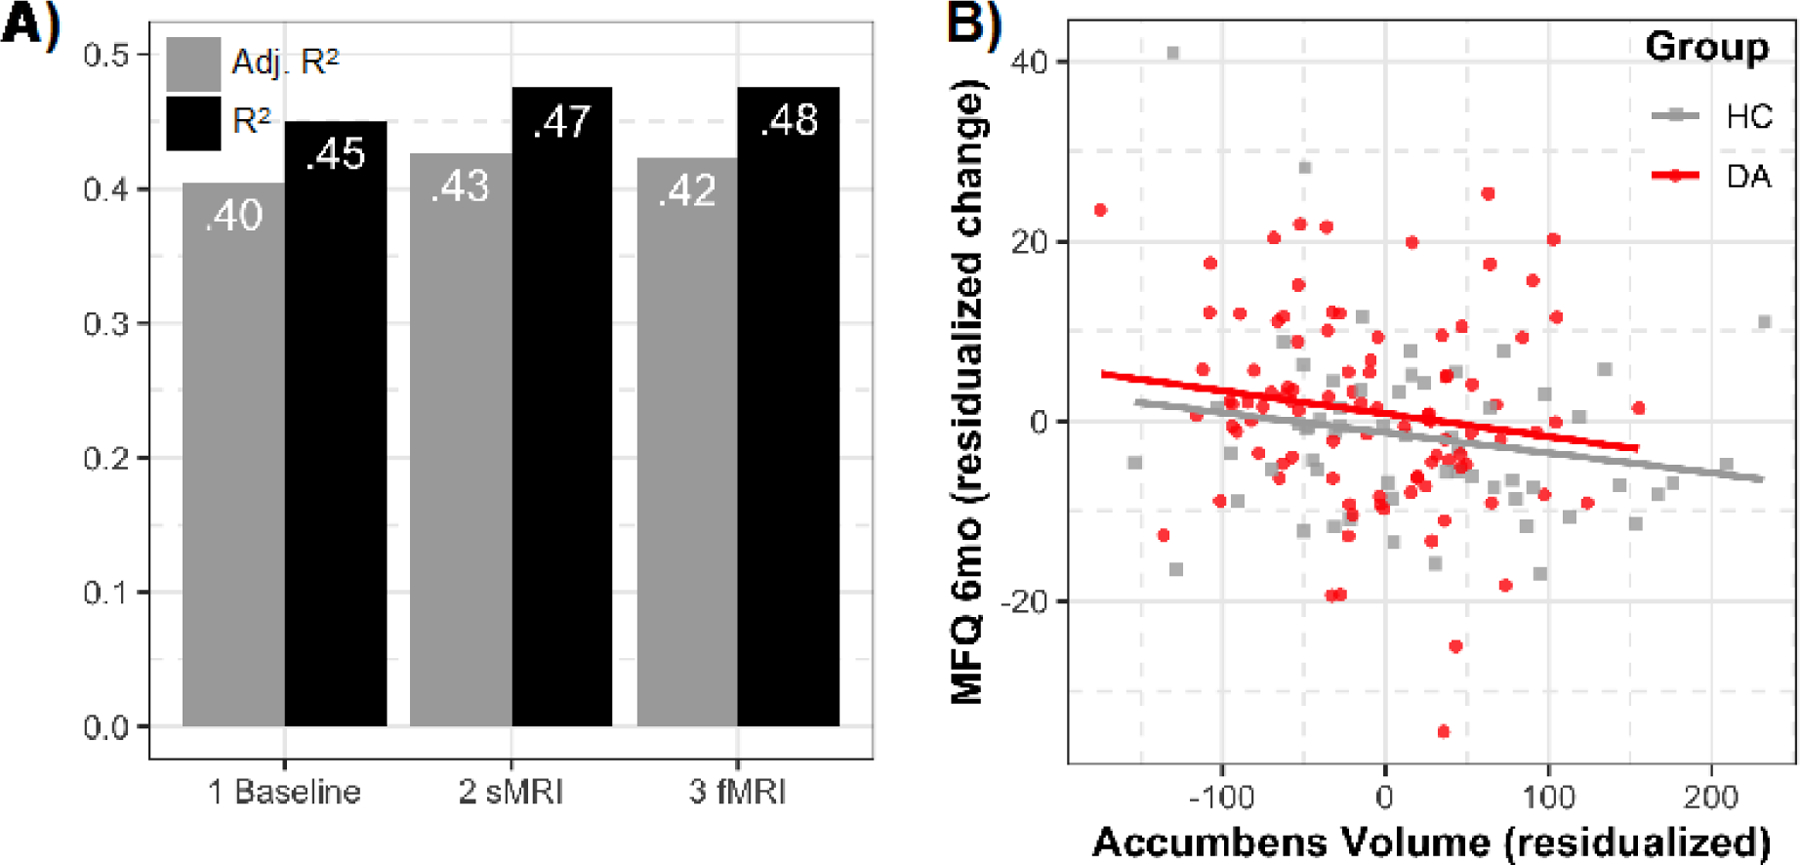
Note. Panel A presents adjusted R2 (gray) and R2 (black) values for the three models tested in the multimodal prediction section predicting MFQ (Mood and Feelings Questionnaire) depression scores at the 6-month follow-up. The first model includes baseline MFQ scores and all covariates. The second model adds average accumbens volumes (sMRI). The third model adds average accumbens Reward vs. Baseline activation (fMRI). Panel B displays the association between residualized accumbens volumes and residualized MFQ (Mood and Feelings Questionnaire) depression scores from the 6-month follow-up, also residualized for all covariates including baseline depression. These represent results from the multimodal prediction model 2 (sMRI) indicating that smaller accumbens volume predict worsening depression symptoms at 6-month follow-up. HC = healthy controls; DA = depressed-anxious.