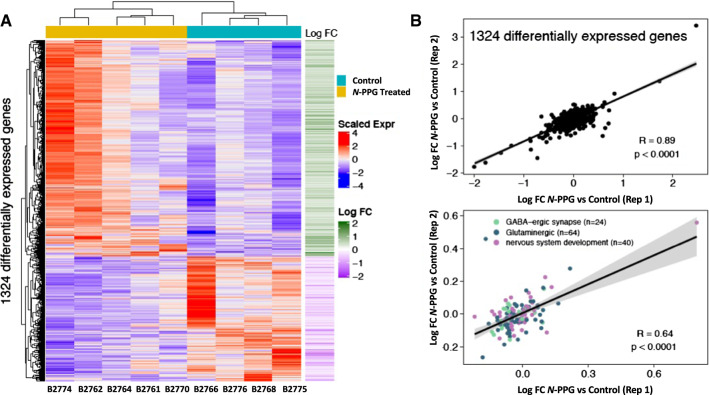
Fig. 5.
Transcriptomic comparison of control and N-PPG-treated mouse brains. A Gene expression heat map and unsupervised hierarchical clustering of 1324 genes found to be differentially expressed (p < 0.05; Supplementary Table 1) between five N-PPG-treated mouse brains and four saline-treated control brains. All treated mice received 9 days of 50 mg/kg N-PPG except B2774 who received 100 mg/kg N-PPG. Scaled gene expression is shown alongside log-fold changes (Log FC). Upregulated genes (red on heatmap and corresponding green Log FC) include 841 of the 1324 differentially expressed genes; and by over-representation analysis these encode 77 enriched Gene Ontology (GO) pathways (Supplementary Table 2) and 7 Reactome neural pathways (Supplementary Table 4) having FDR significance p < 0.05. B Pearson correlations (Rp) and linear regressions of Log FC gene expression differences between blinded RNAseq analysis of treated and control technical replicates (Reps 1 and 2) as described in Methods: (top plot) across all 1324 differentially expressed genes; (bottom plot) for the 127 non-redundant over-represented genes comprising enriched GO terms for nervous system development (n = 40), glutaminergic (n = 63) and GABAergic (n = 24) synapses (Supplementary Table 3). Grey bands around the predicted regression lines represent 95% confidence intervals

