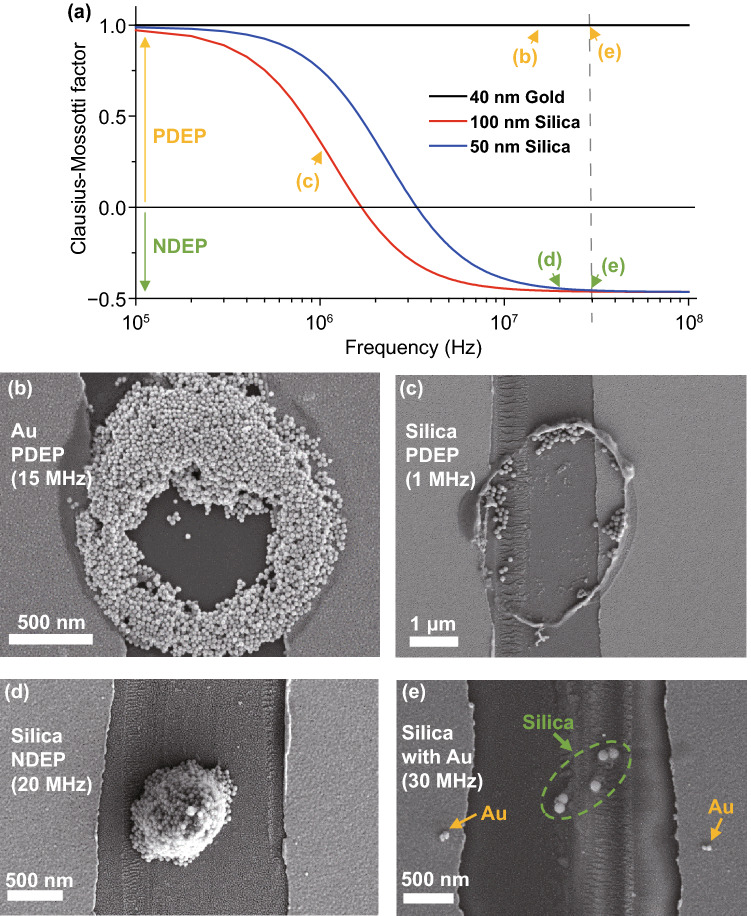
Fig. 3.
SEM images of PDEP and NDEP experiments. a Clausius–Mossotti factor () of nanoparticles used for experiments. Several characteristics () of Au and silica nanoparticles are from reference [29]. The X-axis is a log scale of the frequency (Hz). Signs of change at ~2 MHz (100 nm silica), ~4 MHz (50 nm silica), and of 40 nm Au always has a plus sign in the 0.1–100 MHz range. Arrows show the frequencies used, and colors indicate PDEP (yellow) or NDEP (green). b PDEP result of Au nanoparticles with 40 nm diameter Au nanoparticles, ~2 µm diameter pipette with ratio = 0.7, 1.0 V, and 15 MHz frequency. Particles are attracted to surface electrodes of the substrate and the pipette. c PDEP result of silica nanoparticles with 100 nm diameter silica nanoparticles, ~ 2 µm diameter pipette, 2.5 V and 1 MHz frequency. Particles show the same tendency as in a. The concentration and surfactants of nanoparticle solutions result in differences between b and c. d NDEP result of silica nanoparticles with 50 nm diameter silica nanoparticles, ~1.5 µm diameter pipette, 2.5 V, and 20 MHz frequency. Particles move off to the surface electrodes of the substrate and pipette and gather around the center of the pipette. e Sorting result of the mixed solution with 100 nm diameter silica nanoparticles and 20 nm diameter Au nanoparticles, 2.5 V, and 30 MHz frequency. Silica nanoparticles in the green circle show NDEP and Au nanoparticles next to the yellow arrows show PDEP

