Fig. 4.
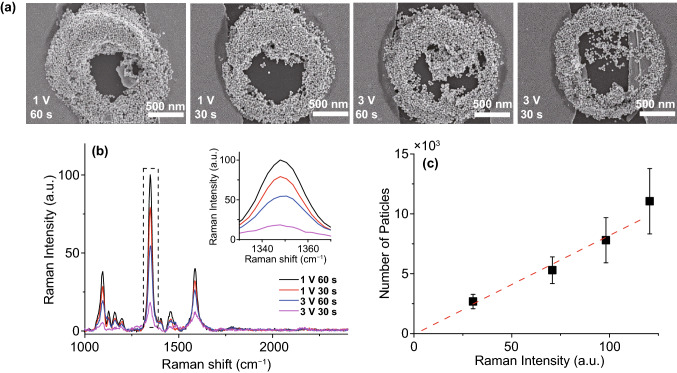
SERS results of various PDEP Au nano-aggregates samples. a SEM images of Au nano-aggregates deposited by PDEP; 500 nm scale bar. b SERS spectra of various Au nano-aggregates coated with 4-nitrobenzenethiol; the inset graph is the expanded spectra in the dotted line (nitro group). c Raman intensity and particle count graph. The ratio of Raman intensity of peaks in the inset graph of b is linearly well-fitted (red dashed line) with the ratio of the number of Au nanoparticles, which indicates that Au nanoparticles enhanced Raman signal. Therefore, the system can be used for the fabrication of the nano-micro SERS platform by the enrichment of nanoparticles such as in the coffee-ring effect

