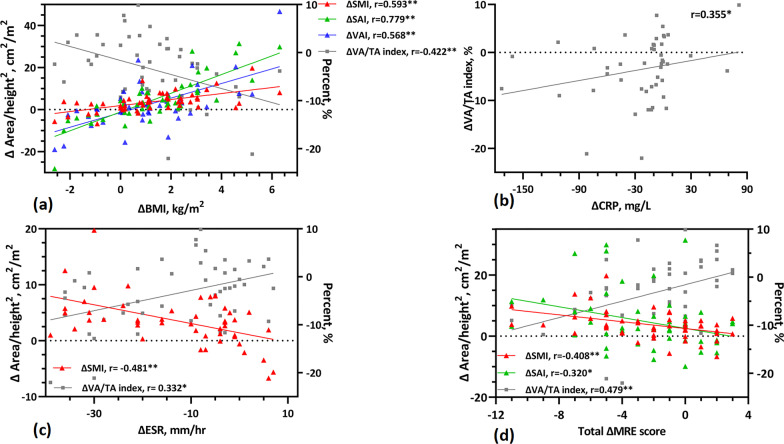
Fig. 6.
Scatter plots showing the correlation between changes in clinical indicators, MRE score, and body composition parameters during follow-up. a Correlation between changes of body composition parameters (ΔSMI, ΔSAI, ΔVAI, and ΔVA/TA) and BMI; b Correlation between ΔVA/TA and ΔCRP; c Correlation between changes of body composition parameters (ΔSMI and ΔVA/TA) and ESR; d Correlation between changes of body composition parameters (ΔSMI, ΔSAI, and ΔVA/TA) and total MRE score. **: p < 0.01, *: p < 0.05; BMI, body mass index; CRP, C-reactive protein; ESR, Erythrocyte sedimentation rate; SMI, skeletal muscle index; SAI, subcutaneous adipose index; VAI, visceral adipose index, VA/TA index: VAT to total adipose tissue ratio; Δ(i) =(i)Valuefollow-up − (i)Valuebaseline, i= BMI, SMI, SAI, VAI, VA/TA, CRP, ESR, MRE score

