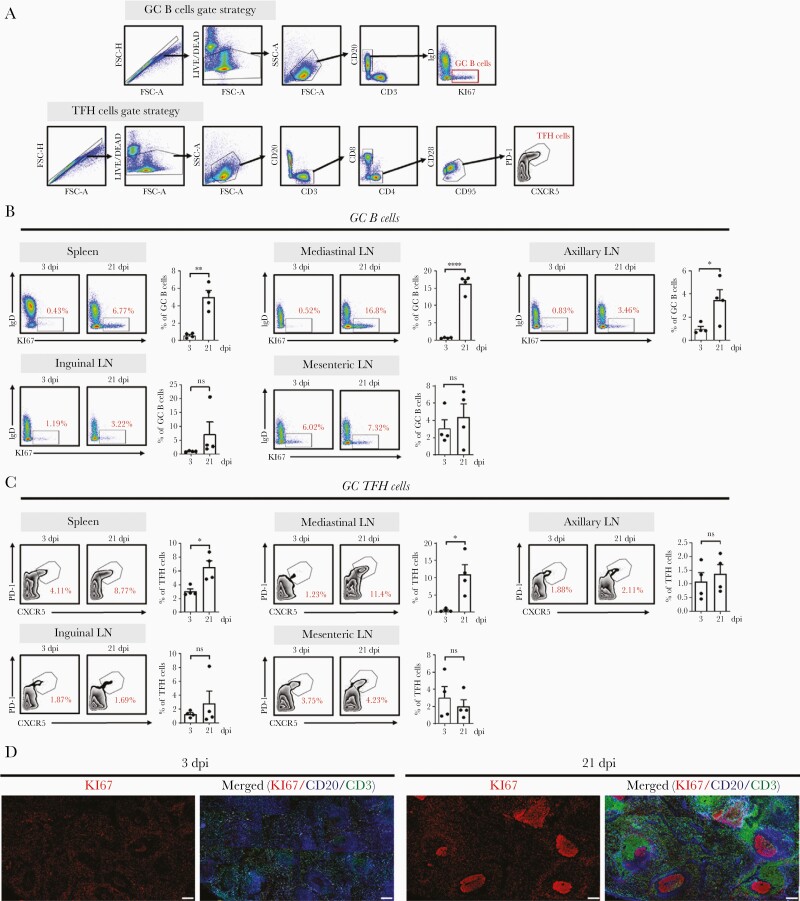
Figure 3.
SARS-CoV-2 infection induces GC formation. A, Representative gating strategy for GC B and TFH cells. B, Frequency of GC B cells in the spleen, LN, axillary LN, inguinal LN, and mesenteric LN collected at 3 and 21 dpi. Data are presented as mean±SEM (unpaired Student t test; ∗P<.05, ∗∗P<.01, ∗∗∗∗P<.0001). C, Frequency of TFH cells in the spleen, mediastinal LN, axillary LN, inguinal LN, and mesenteric LN at 3 and 21 dpi (unpaired Student t test; ∗P<.05). Circles represent individual data obtained from a macaque and bar represents mean±SEM. D, Representative multicolor immunofluorescence images of CD20 (blue), Ki67 (red), and CD3 (green) staining in the spleens at 3 and 21 dpi. Scale bar=200 μm. Abbreviations: dpi, days postinfection; FSC, forward scatter; GC, germinal center; IgD, immunoglobulin D; LN, lymph node; ns, not significant; PD-1, programmed cell death protein 1; SARS-CoV-2, severe acute respiratory syndrome coronavirus 2; SEM, standard error of the mean; SSC, side scatter; TFH, T follicular helper.

