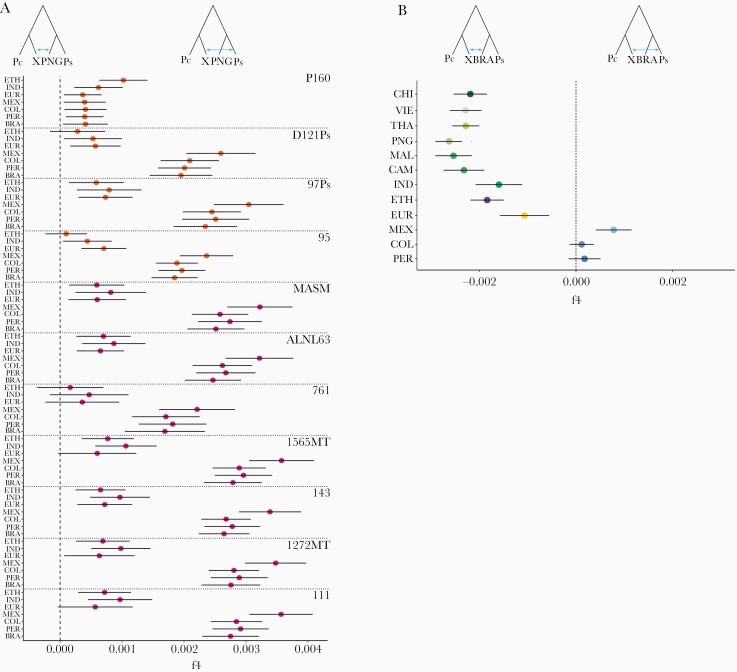
Figure 4.
Genetic affinities of Plasmodium simium with New World isolates of Plasmodium vivax. (A) To explore the genetic affinities of individual isolates of P simium, we computed the f4 statistic for W corresponding to Plasmodium cynomolgi (Pc, outgroup), X to each of the 11 individual isolates of P simium (Ps), Y to the Papua New Guinean (PNG) population of P vivax, and Z to one of the American (Amazonian Brazil [BRA], Mexico [MEX], Peru [PER], and Colombia [COL]), Indian (IND), Ethiopian (ETH), or European (EUR) populations of P vivax, that are indicated on the y-axis legend. Sample codes are shown to the right. Note that P160 is the only P simium isolate that is genetically closer to non-American (ETH and to some extent IND) than American populations of P vivax (also see Supplementary Results). (B) To compare the genetic affinities of the P simium and BRA populations (from the Atlantic Coast and Amazon Basin of Brazil, respectively) with each of the non-BRA P vivax populations, we used the f4 statistic with W corresponding to Plasmodium cynomolgi (Pc), X to the P simium (Ps) population, Y to BRA, and Z to each of 12 non-BRA populations of P vivax, which are indicated on the y-axis legend.

