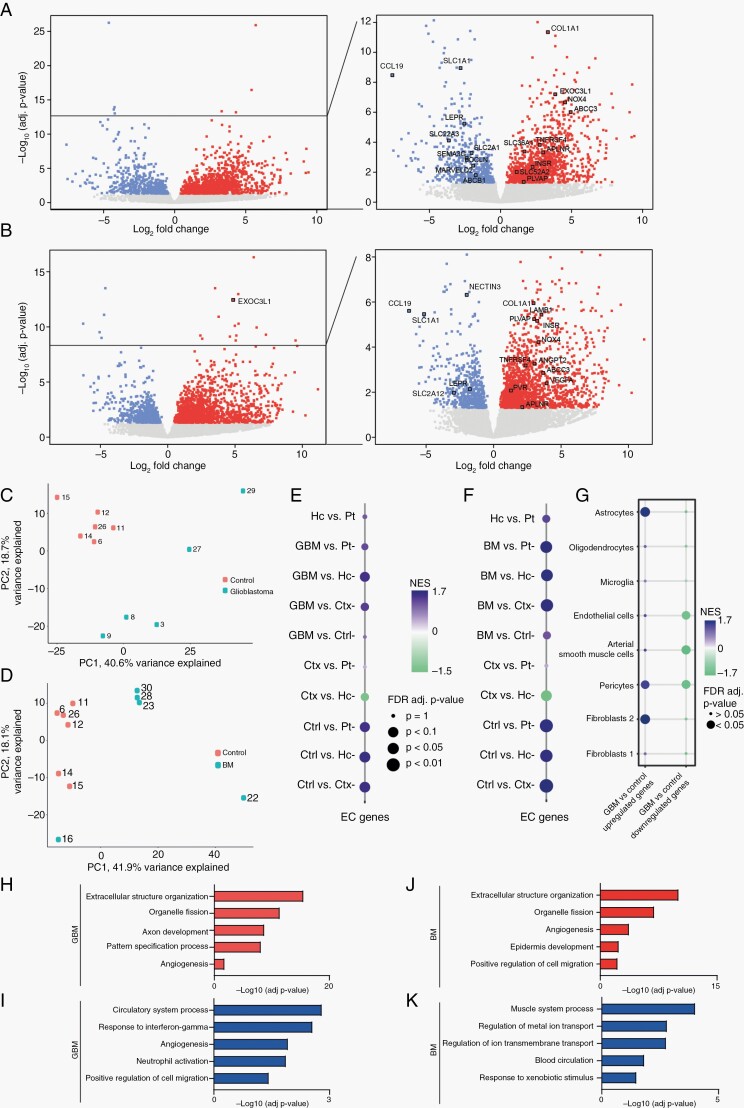
Fig. 1.
Differently expressed genes (DEG) in CD31+ EC fraction isolated from GBM, BM, and normal brain tissue derived by RNA-seq. Volcano plot showing DEG in GBM (A) and BM (B) samples compared to controls. Upregulated genes—in red, downregulated genes—in blue, deregulated genes—in gray. PCA of GBM and control samples (C) and BM vs control samples (D). Dot plot showing a significant enrichment score of 25 core EC genes17 in control (Ctrl) (E, F), GBM (E), and BM (F) samples compared to healthy brain GTEx expression data (Ctx: cortex, Hc: hippocampus; Pt: putamen). (G) Dot plot showing the enrichment score of cell-type-specific genes18 in DEG in CD31+ fraction isolated from GBM tissue. GO overrepresentation analysis of the biological process of DEG in GBM (H, I) and in BM (J, K) vessels. Red and blue color bars show significantly regulated biological processes among upregulated and downregulated genes, respectively. Abbreviations: BM, brain metastasis; EC, endothelial cells; GBM, glioblastoma; GO, gene ontology; PCA, principal component analysis.

