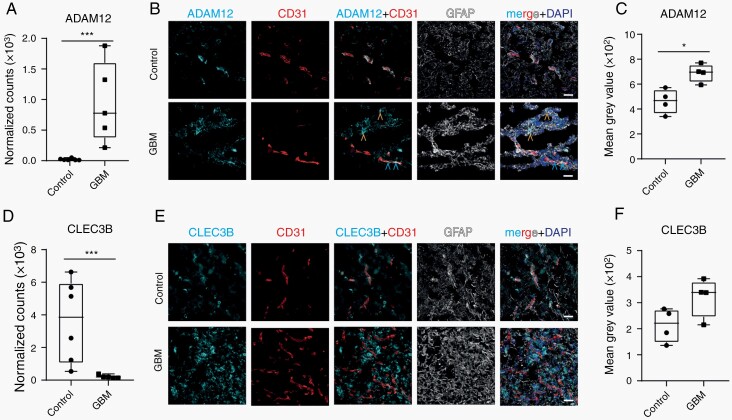
Fig. 3.
Expression of perivascular fibroblast marker genes in normal brain and GBM vasculature. (A) mRNA expression level of ADAM12 in GBM and control samples. (B) Representative image of ADAM12 (in cyan) expression, co-stained with vessels (CD31, in red) and GFAP (in gray) in GBM and control brain tissue. Blue arrowheads point to ADAM12-positive perivascular cells and yellow arrowheads point to ADAM12-positive tumor cells. (C) Quantification of ADAM12 staining around CD31-positive vessels. (D) RNA expression level of CLEC3B in GBM and control samples. (E) Representative image of CLEC3B (in cyan), co-stained with vessels (CD31, in red) and GFAP (in gray) in GBM and control tissue. (F) Quantification of CLEC3B staining around CD31-positive vessels. Cell nuclei are visualized with DAPI (in dark blue, B and E). Statistical tests: A, D—FDR corrected t-test and C, F—two-tailed unpaired t-test. Data distribution was analyzed using the Q-Q plot. *P < .05, ***P < .001. Scale bar—30 µm. Abbreviations: FDR, false discovery rate; GBM, glioblastoma.

