Fig. 2.
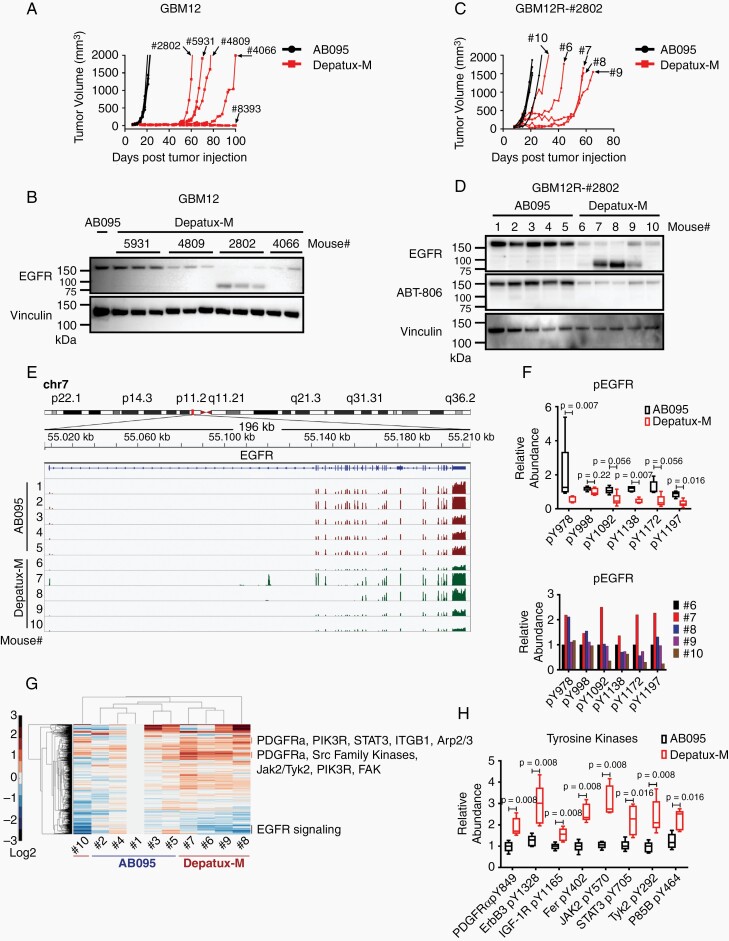
Modulated EGFR expression imparts resistance to Depatux-M therapy in recurrent GBM12 PDX line. (A) Recurrent tumor growth of GBM12 PDX after AB095 (5 mg/kg) and Depatux-M (5 mg/kg) therapy. Four-digit numbers denote a truncated animal ID#. Data is from the same experiment shown in Figure 1D for GBM12. (B) EGFR expression in AB095-treated and serially passaged recurrent Depatux-M treated tumors derived from GBM12. Vinculin was used as a loading control. (C) Tumor growth of GBM12R-#2802 subline in the flank of mice treated with weekly intraperitoneal injections of AB095 (5 mg/kg) and Depatux-M (5 mg/kg). Single digit number corresponds to individual mice/tumors analyzed subsequently. (D) EGFR expression detected by anti-EGFR and ABT-806 antibody in the lysates from AB095 and Depatux-M treated GBM12R-#2802 tumors. Vinculin was used as a loading control. (E) EGFR gene exon usage with differential expression in AB095 and Depatux-M treated GBM12R-#2802 tumors as assessed by RNAseq analysis. (F) Relative abundance of phosphopeptides of EGFR in AB095 and Depatux-M treated mice, and graph below shows relative levels in individual Depatux-M treated mice. (G) Heat map with relative levels of phosphopeptides after Depatux-M treatment of GBM12R-#2802 subline as detected by phosphotyrosine proteomics analysis. (H) Relative abundance of phosphopeptides from tyrosine kinases; PDGFRα, ErbB3, IGF-1R, Fer, JAK2, STAT3, TYK2 and P85B following AB095 and Depatux-M treatment. Significance between AB095 and Depatux-M treated groups in F and H was calculated using Mann–Whitney test.

