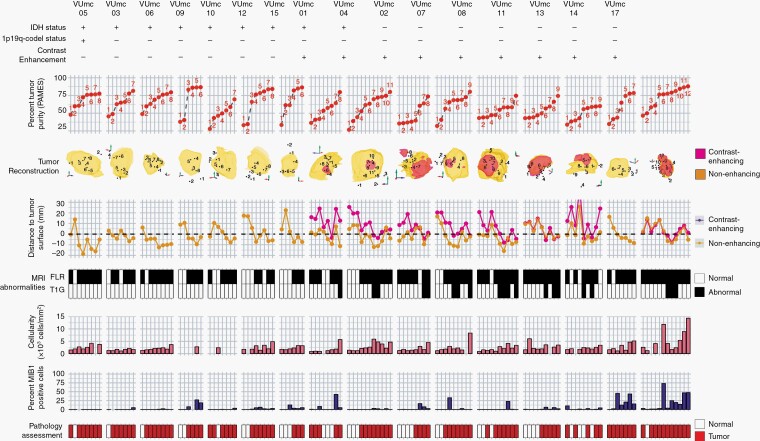
Fig. 2.
Overview of 133 samples in 16 patients with initial diffuse glioma. Samples are numbered in order of tumor purity for each patient. First row = IDH status with + representing a mutation, 1p/19q status with + representing a codeletion, and contrast enhancement with + representing the presence of contrast on T1c MRI. Second row = tumor purity assessed with PAMES. Third row = 3D reconstruction of FLAIR (yellow), T1c MRI (red) abnormalities, and sample locations. Due to the 2D representation of 3D object samples behind and outside the abnormalities might appear to be within the abnormalities. Fourth row = Euclidean distance (mm) between sample coordinate and tumor surface assessed with FLAIR (yellow) and T1c MRI (red). Negative values indicate samples obtained within the tumor volume. Fifth row = the presence of abnormalities on FLAIR (top) and T1c MRI (bottom) at the sample location. Sixth row = median cellularity and percentage of MIB1-positive cells of the sample, and final row = consensus assessment of tumor presence by 2 neuropathologists. Abbreviations: FLAIR, fluid-attenuated inversion recovery; IDH, isocitrate dehydrogenase; MRI, magnetic resonance imaging; PAMES, Purity Assessment from clonal MEthylation Sites; T1c, contrast-enhanced T1-weighted.

