Fig. 4.
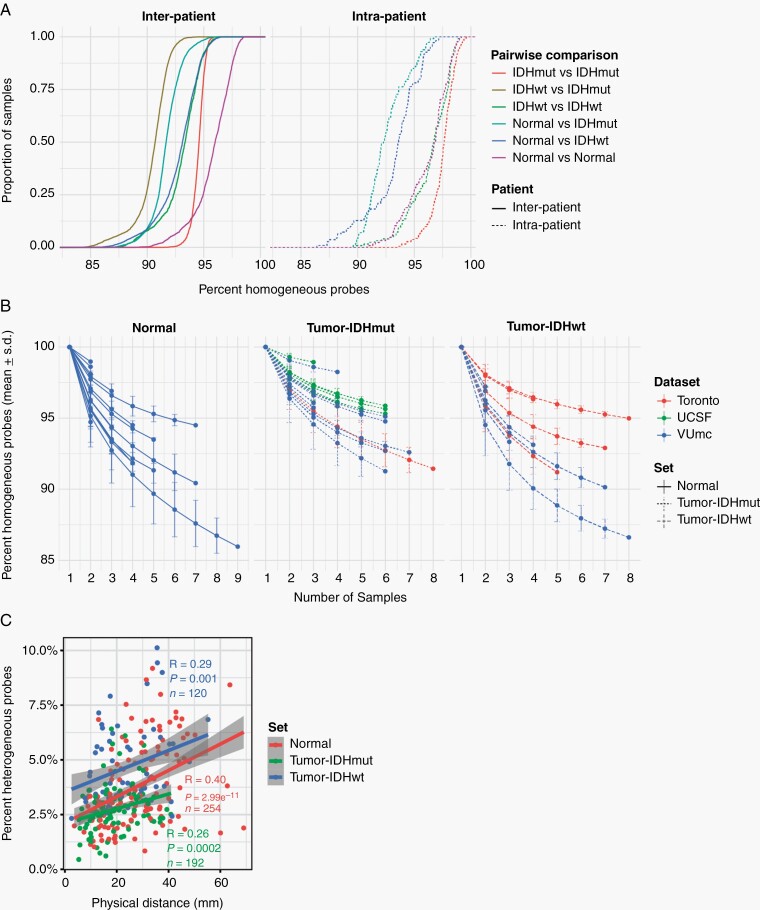
Spatial heterogeneity of genome-wide methylomes. A. Empirical cumulative density function (ECDF) curves reflecting similarity (homogeneity) across all pairwise combinations of samples. Comparisons were separated based on whether they involved 2 samples from the same patient (intra-patient) or between 2 patients (interpatient) and based on whether the 2 samples spanned one or multiple sample types. B. Line plot showing the cumulative homogeneity associated with additional samples taken from the same tumor. Lines were colored by dataset, tumor and normal samples were separated, and tumor samples were further separated into IDH-mutant and IDH-wildtype. C. Scatter plot of the relation between distance and methylation heterogeneity. Distance is the Cartesian distance in mm between 2 samples and methylation heterogeneity as described above. Correlation is calculated with Pearson R.

