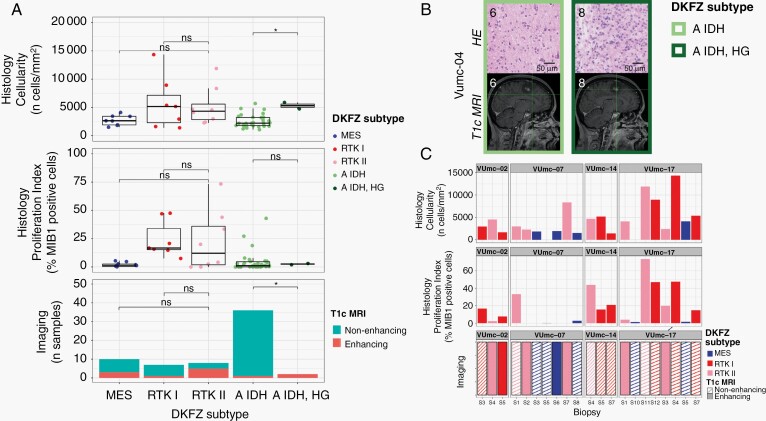
Fig. 6.
Histology and imaging of patients with DNA methylation subtype heterogeneity. A. Boxplots of cellularity (upper) and proliferation index (middle) and barplot of T1c MRI contrast enhancement (lower) for the DKFZ subtypes MES (blue), RTK I (red), RTK II (pink), A IDH (light green), and A IDH, HG (dark green) of all patients from the exploration cohort. Statistical significance is given using the Mann-Whitney U test for the continuous data (Histology) and the chi-squared test for the frequency data (Imaging), with * representing P < .05. B. Representative examples of the histological and radiological images of the patient VUmc-04: HE-stained histology slide of a sample classified as A IDH (S3) and A IDH, HG (S9) showing the higher cellularity in the A IDH, HG sample. Sagittal T1c MRI images of the same samples showing contrast enhancement in the A IDH, HG, but not in the A, IDH sample. C. Barplot of cellularity (upper), proliferation index (middle), and contrast enhancement on T1c MRI (lower) of the tumor samples of glioblastoma patients of the exploration cohort with subtype heterogeneity. Abbreviations: HE, hematoxylin and eosin; MRI, magnetic resonance imaging; T1c, contrast-enhanced T1-weighted.

