
Figure 1.
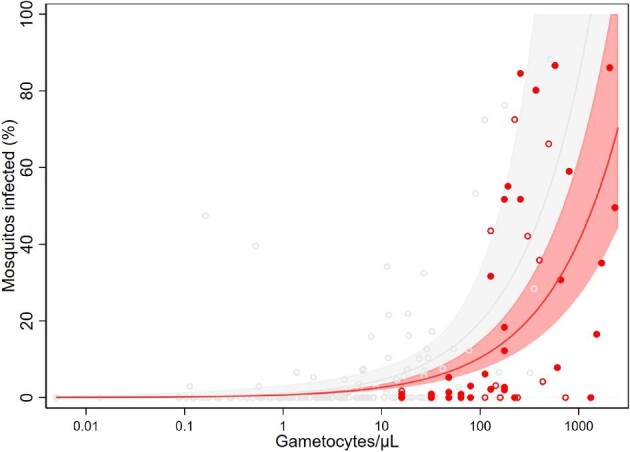
Relationship between total gametocyte density and the percentage of mosquitoes that develop oocysts. Red dots are observations from this study: open red dots correspond with febrile participants and solid red dots with non-febrile participants; the solid red line indicates the best-fit model, with the light red shaded area indicating the 95% CI around this line. Grey open dots correspond to observations from a previous study4; the solid grey line indicates the best-fit model, with the light grey shaded area indicating the 95% CI around this line.