Figure 3.
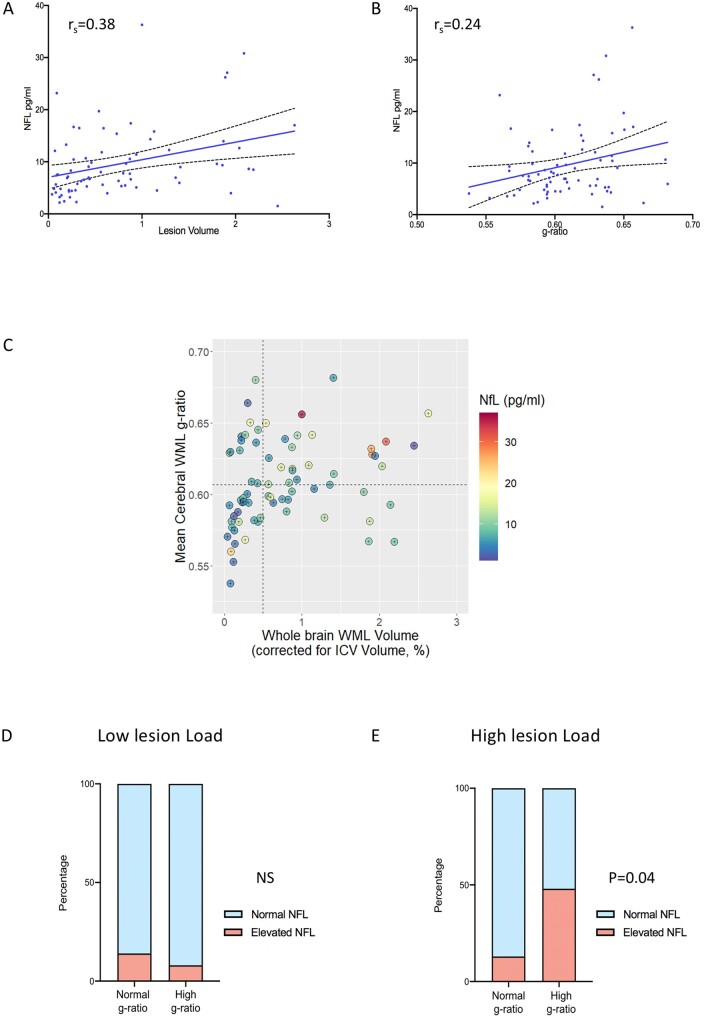
Influence of cerebral white matter lesion g-ratio on plasma neurofilament levels at multiple sclerosis diagnosis. A shows plasma neurofilament levels are associated with intracranial volume (ICV)-corrected WML volume, Spearman’s rho = 0.38, P = 0.001. B shows plasma neurofilament levels are associated with WML g-ratio, Spearman’s rho = 0.24, P = 0.05. C shows relationship between whole brain WML volume (as a percentage of ICV), lesional g-ratio and plasma neurofilament in study subjects. Dotted lines represent cut-offs used to define categories (low lesion load versus high lesion load, and normal g-ratio versus high g-ratio). In patients with low WML volume at diagnosis, there was no significant difference between the proportion of patients with abnormally raised plasma neurofilament [3/22 versus 1/13, no significant difference in proportion (N.S.), Fisher’s Exact test], shown in D. In patients with substantial WML volume at diagnosis, a higher proportion of patients (48%) with a high lesional g-ratio had abnormally raised neurofilament compared to those with normal g-ratios (11/23 versus 2/15, P < 0.05, Fisher’s Exact test), shown in E.

