Figure 1 .

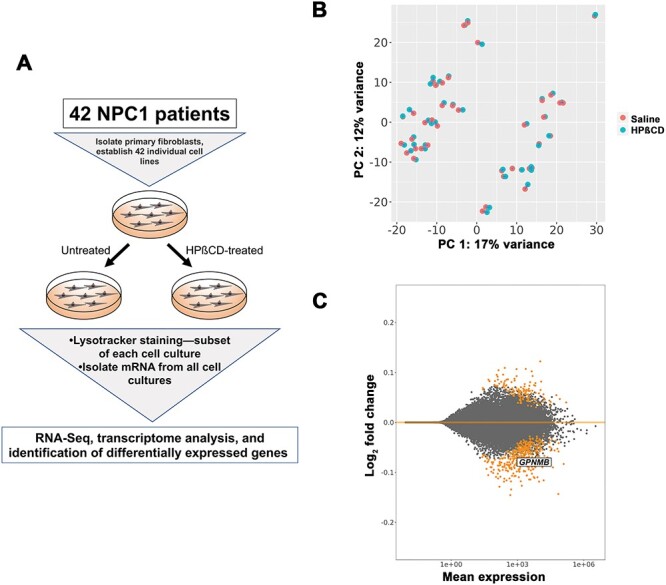
Analysis of differentially expressed genes in NPC1 patient-derived fibroblasts treated with HPβCD. (A) Experimental design. Individual cell lines were established from each patient, then split into cultures that were treated with saline or HPβCD. Lysotracker staining was performed on a subset of cells from each culture. The mRNA from each culture was subjected to RNA-Seq and differential expression analysis, in which pairwise comparisons between saline- and HPβCD-treated samples from the same patient were used. (B) Principal component analysis (PCA) plot showing that the differences between sex (PC 1) are much greater than the difference between saline-treated (orange) and HPβCD-treated (teal) cells. The blue lines connect data points from the same patient. (C) MA plot summarizing results of the differential expression contrast using ‘cell line’ as a blocking factor to control for the patterns observed in (B). Significantly different genes with FDR < 0.1 are shown in orange. Magnitude of the effect (log2 fold change) is on the y-axis, and the normalized read count (averaged across all replicates) is on the x-axis.
