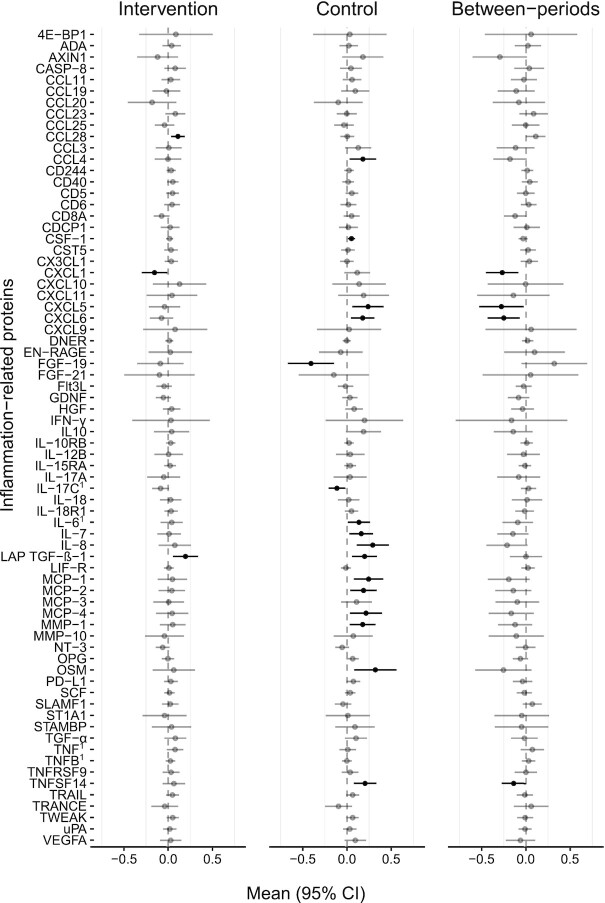
FIGURE 2.
Changes in concentrations of inflammation-related proteins within and between dietary periods measured in participants completing at least one diet period who did not discontinue or start any new disease modifying anti-rheumatic drug or glucocorticoid therapy, n = 26. Black colored lines denotes P < 0.05. Concentrations are presented in an arbitrary, semiquantitative log2 scale that is valid for comparison of relative concentrations between different time points within individuals, analyzed using a linear mixed model with period, treatment, BMI, and baseline value as fixed effects and subject as random effect. See Supplemental Table 1 for abbreviations. 1Analyzed and presented on a log10 scale in order to comply with model assumptions.

