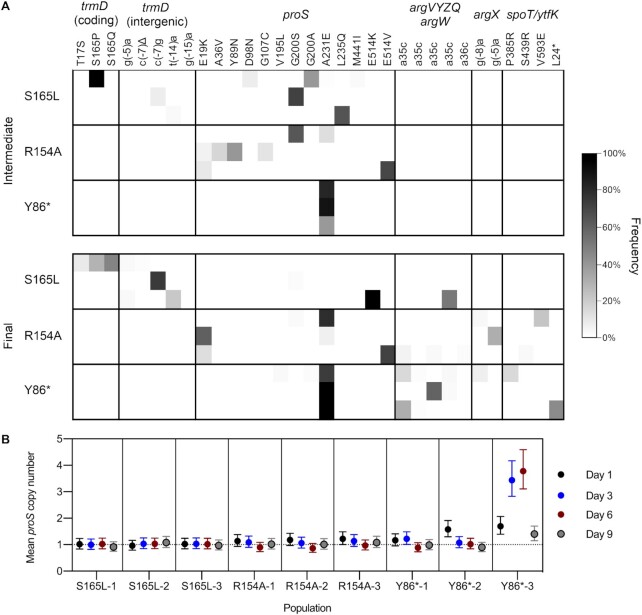
Figure 4.
Evolutionary dynamics of adaptation to trmD deficiency. (A) Comparison of mutation frequencies in each S165L, R154A, and Y86* population at an intermediate (day 9) and final time point (day 22 or day 30). Each row represents one population, each column represents one mutation, and the shading represents the observed frequency of the mutation. Mutations observed only in the G117N populations are not shown. (B) Mean copy number of proS in population genomic DNA from the S165L, R154A and Y86* populations at different time points, measured by qPCR. Error bars represent 95% confidence intervals. Estimates are derived from three technical replicates per primer pair for each sample. Significance testing was performed by one-way ANOVA with Dunnett's test for multiple comparisons using a significance threshold of P< 0.05. The following populations showed a statistically significant increase in proS copy number compared with WT E. coli: R154A-3 (day 1) (P = 0.0400), Y86*-1 (day 3) (P = 0.0371), Y86*-2 (day 1) (P < 0.0001), and all Y86*-3 time points (P < 0.0001).

