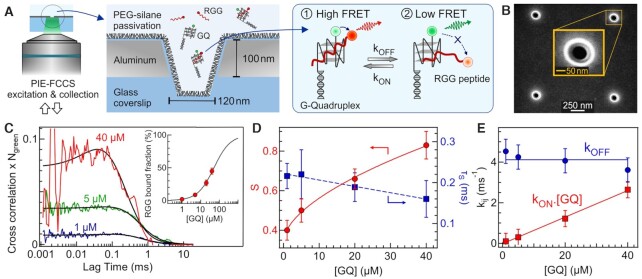
Figure 1.
GQ–RGG interaction dynamics monitored at μM concentrations inside a ZMW nanoaperture. (A) Scheme of the experiment. kon and koff are the association and dissociation rate constants respectively. (B) Scanning electron microscopy image of a 120 nm ZMW nanoaperture. (C) FCCS curve at different GQs concentrations. The RGG concentration is fixed at 1 μM in all the measurements. Black lines are the FCCS fits according to equation 7. The inset shows the bound fraction of RGG peptide as a function of GQs concentration together with a Hill equation fit (Eq. 10) to determine the dissociation constant. (D) Amplitude S and time scale τS of the interaction dynamics as a function of GQs concentration. (E) Association kon.[GQ] and dissociation koff rate as a function of GQs concentration.

