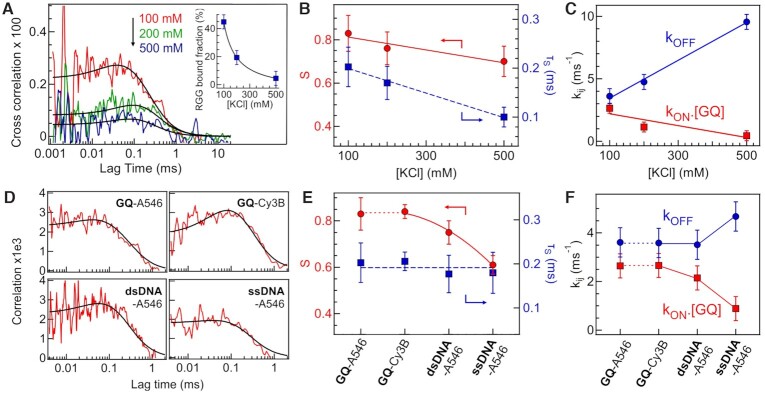
Figure 2.
Influence of salt concentrations and DNA sequence. (A) FCCS curve at different KCl concentrations. The RGG and GQ concentrations are 1 and 40 μM, respectively. The inset shows the bound fraction of RGG peptide. (B) Amplitude S and characteristic time τS as a function of KCl concentration. (C) Association kon.[GQ] and dissociation koff rate as a function of KCl concentration. (D) FCCS curves obtained for different DNA samples: Alexa 546 labelled G-quadruplex (GQ-A546), Cy3B labelled G-quadruplex (GQ-Cy3B), Alexa 546 labelled 51 bases DNA single strand (ssDNA-A546), and Alexa 546 labelled 51 bp DNA double strand (dsDNA-A546). (E) S and τS for the different DNA samples. (F) Association kon.[GQ] and dissociation koff rates for different DNA samples.

