Figure 3.

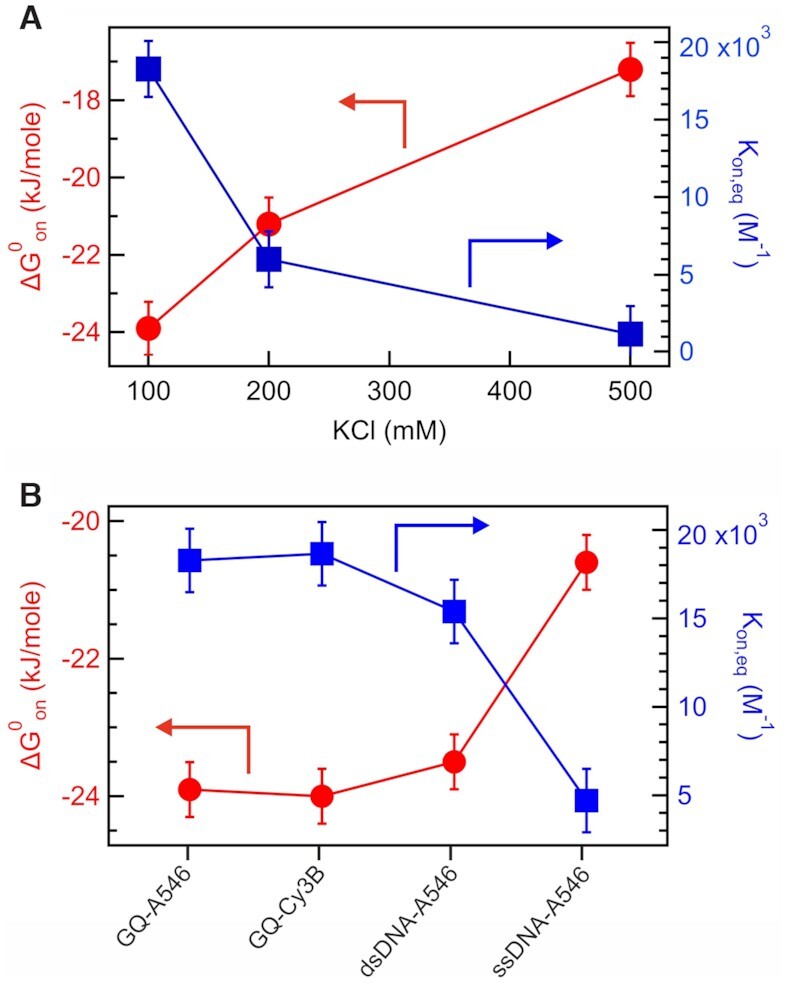
Thermodynamics of the RGG association. (A) Plot of equilibrium constant (Kon,eq) and free energy change for association ( ) between GQs and RGG as a function of KCl concentration. (B) Kon,eq and
  for the association of RGG with different DNA structures.
