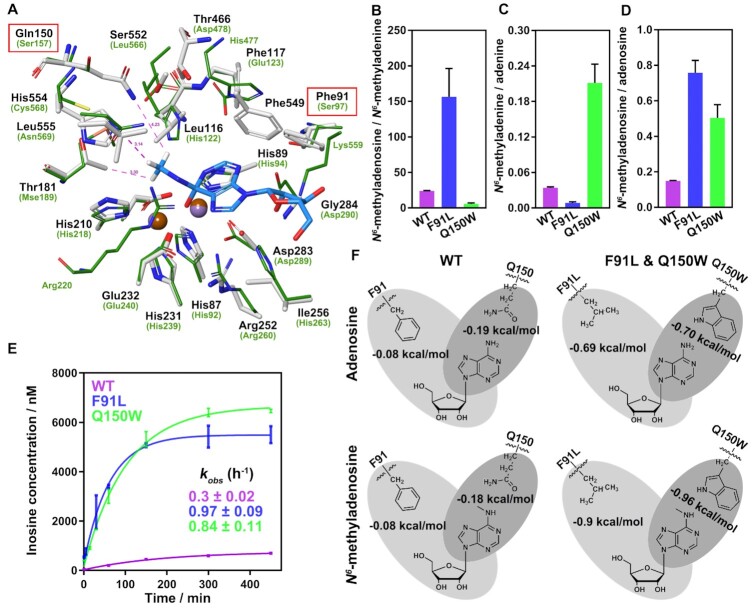
Figure 3.
Biochemical and computational characterization of purified Bsu06560 mutants. (A) Superimposition of the N6-methyl surrounding residues for the high energy intermediate of N6-methyladenosine in Bsu06560 homologous model (white stick) and the adenine deaminase (atuADE, renamed Atu4426, PDB code: 3NQB, green line). Brown and violet balls represent metals in Bsu06560 and atuADE, respectively. Another metal ion in atuADE was hidden due to its unnecessary activity. Pink dotted lines indicate the distance between atoms (angstrom). (B–D) Product ratios of WT, Q150W and F91L mutant in deamination reaction at the 120 min. The substrates were saturated with enzymes. The F91L and Q150W mutants had a higher ratio than wild-type protein in product amount of N6-methyladenosine/N6-methyladenine and N6-methyladenine/adenine. Low concentrations of substrates (10 μM) were used where the enzyme was excess (20 μM). The integral areas of chromatographic peaks of LC-HRMS were used to determine the concentration of products. Mean values were plotted (n = 3). The error bars represent the ± SEM. (E) Deamination time courses for the Bsu06560 mutants for N6-methyladenosine. Mean values were plotted (n = 3). The error bars represent the ± SEM. The mutants Q150W and F91L of Bsu06560 had a substantially increased deamination activity for N6-methyladenosine. The data points were best fitted using a single exponential equation to follow the formation of inosine or hypoxanthine (GraphPad Prism software). The kobs value for inosine formation was estimated using the one-phase association model. (F) Simplified scheme of interactions between key residues of Bsu06560 and its mutants with N6-methyladenosine and adenosine. Non-bonded interactions are indicated in gray, and relative energies of interaction are provided in kcal/mol.

