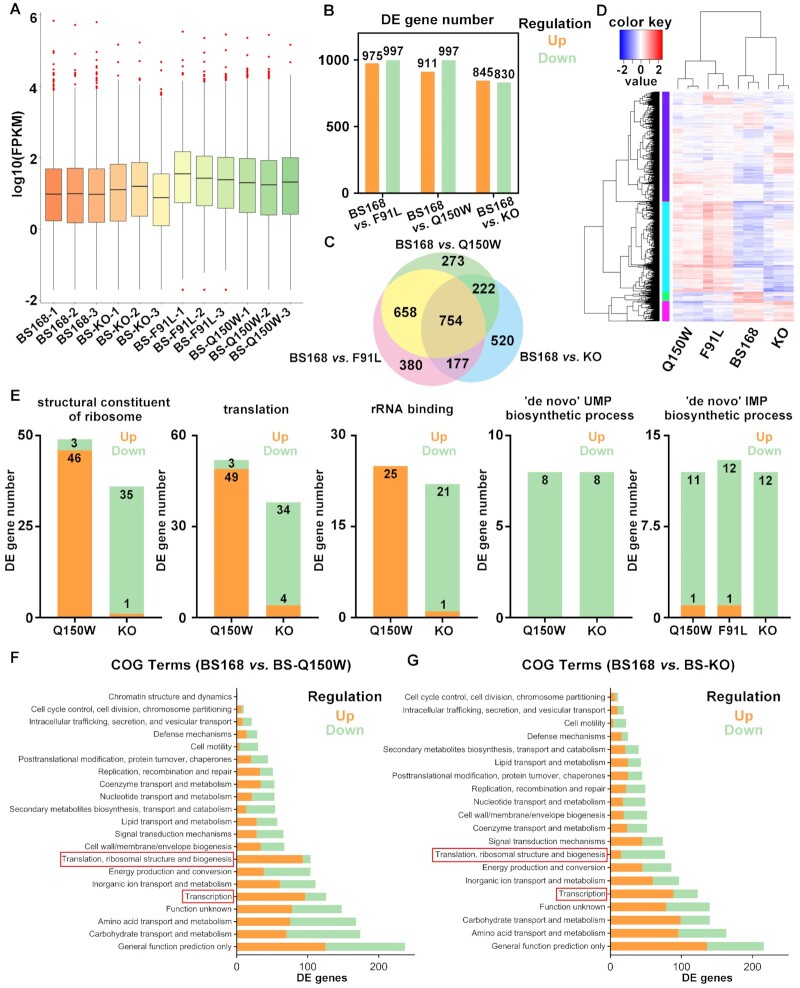
Figure 4.
Transcriptomic profiling of BS168 (WT), BS-KO, BS-F91L and BS-Q150W strains. (A) Global gene expression analysis of all RNA sequencing samples. The BS-F91L and BS-Q150W strains had higher gene expression levels than wild-type. (B) Number of DE genes in BS168 versus BS-KO, BS168 versus BS-F91L and BS168 vs. BS-Q150W groups identified via RNA sequencing. (C) Overlap of the DE genes in BS168 versus BS-KO, BS168 versus BS-F91L and BS168 versus BS-Q150W groups. (D) Hierarchical clustering of DE genes in wild-type and variant strains (red and blue represent up-regulated and down-regulated genes, respectively). (E) Gene expression patterns in several GO enrichment items. The BS-Q150W and BS-KO strains showed contrasting expression patterns in ‘structural constituent of ribosome’, ‘translation’ and ‘rRNA binding’ items, and similar expression patterns in ‘‘de novo’ UMP biosynthetic process’ and ‘‘de novo’ IMP biosynthetic process’. (F) The COG classification of the DE genes in BS168 vs. BS-Q150W group. (G) The COG classification of the DE genes in BS168 versus BS-KO group. (F, G) The BS-Q150W and BS-KO strains with contrasting expression patterns in ‘Translation, ribosomal structure and biogenesis’ term and similar expression patterns in ‘Transcription’ term.

