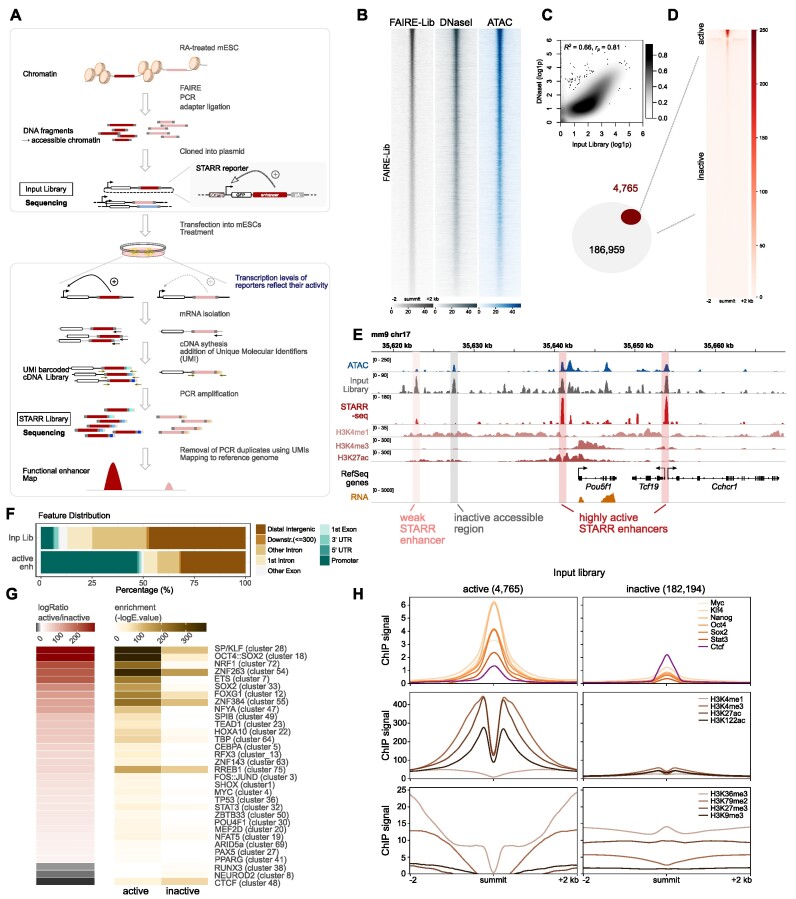
Figure 1.
FAIRE-STARR-seq in mouse embryonic stem cells. (A) Schematic representing the workflow of FAIRE-STARR-seq. (B) Heatmaps depicting normalized read distribution of the FAIRE-STARR input library, DNase- and ATAC-seq at the FAIRE-STARR input regions. (C) Correlation analysis of genome-wide read distribution, comparing the input library with DNase-seq data (ENCODE). Normalized and log1p transformed reads per 10 kb genomic bin are shown. (D) Heatmap showing normalized FAIRE-STARR-seq signal at active (4765) or inactive (182 194) input regions. (E) Exemplary genomic region encompassing the Pou5f1 gene. The FAIRE-STARR-seq signal merged from three replicates (normalized to input) is shown and the three active (weakly and highly active) regions detected in the depicted region, as well as one exemplary inactive region covered by our library, are highlighted. In addition, ChIP-seq data of histone modifications (HMs) as indicated, RNA-seq, ATAC-seq and input library signal from mESCs are shown. (F) Genomic distribution of input regions and FAIRE-STARR enhancers with respect to annotated Refseq genes. Promoters were defined as the regions 1 kb upstream of a TSS. (G) Motif enrichment analysis comparing the 4765 FAIRE-STARR active and an equal number of randomly sampled inactive input regions (mean E-values of ten subsamplings from inactive regions). Enrichment of motif clusters is indicated as −log10E-value and the -log ratio comparing active versus inactive enrichment is shown. Enriched motifs (E ≤ 1e−3) with a minimum 15-fold −log difference of E-values between the two groups are shown. The JASPAR 2018 vertebrate clustered motif database was used as reference and listed TF names display TF groups clustered by consensus motif similarity (57). (H) Anchorplots showing mean normalized ChIP-seq enrichment of the indicated HMs or TFs at FAIRE-STARR active or inactive input regions.

