Figure 3.
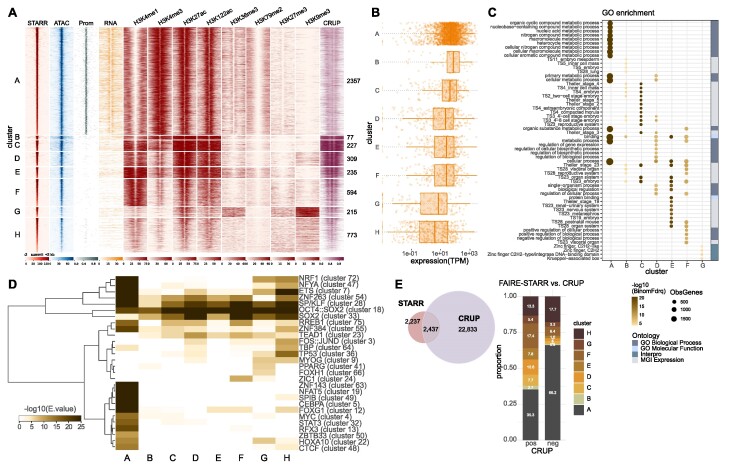
Functional mESC enhancers reside in different epigenomic environments. (A) FAIRE-STARR enhancers were clustered (k-means clustering) based on the enrichment of the eight investigated histone modifications. For each cluster, the STARR-, ATAC- and RNA-seq signals were plotted as were promoter regions (Prom) defined as 1 kb up- and downstream of the TSSs of annotated Refseq genes. Enhancer probability scores predicted by CRUP from mESC data are also shown. (B) Genes were assigned to enhancer clusters using GREAT and RNA-seq expression data is shown as dots for individual genes (TPM normalized) and as boxplots for each enhancer cluster. (C) Gene ontology analysis of genes associated with each enhancer cluster showing the fifteen most significant GO terms per cluster and their false discovery rate (-log10BionomFdrQ, cutoff 1e−03). For each ontology, the number of observed genes (ObsGenes), the significance, and the source of the assigned ontology are shown. (D) TF motif enrichment analysis (AME) for each enhancer cluster using the JASPAR 2018 vertebrate clustered motif matrices. TF motifs which were enriched (E ≤ 1e−5) for at least one cluster were clustered for TF occurrences applying wards clustering and Manhattan similarity measures. (E) Venn diagram showing the intersection of FAIRE-STARR and CRUP enhancers. FAIRE-STARR enhancers which overlap with CRUP enhancers (pos) or do not overlap (neg) were assigned to the HM clusters defined in (A).

