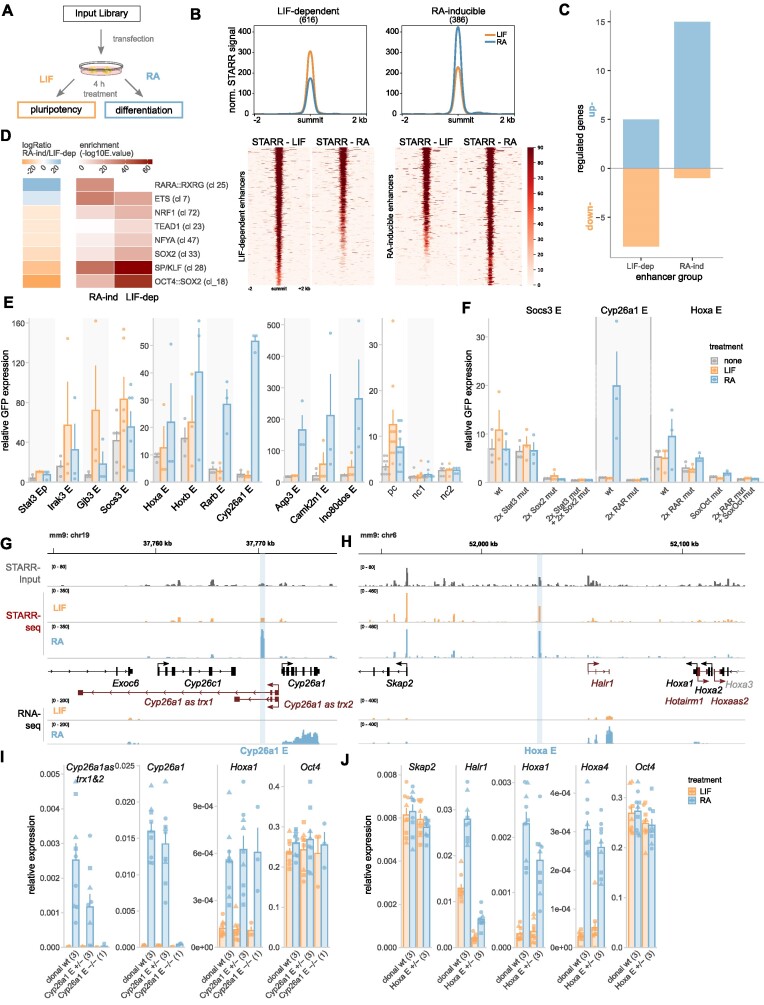
Figure 5.
Differentiation-associated changes in enhancer activity. (A) Treatment scheme to investigate how inducing differentiation of mESCs changes enhancer activity. (B) Mean FAIRE-STARR signal (top) and heat-maps (bottom) for LIF-dependent and RA-inducible STARR enhancers. (C) Number of differentially expressed genes (|log2FC| ≥ 1, Padj ≤ 0.05) paired with enhancers by distance using GREAT. (D) Differentially enriched TF motif clusters (JASPAR 2018 vertebrate clustered matrices) for RA-induced and LIF-dependent enhancers were identified using AME (E ≤ 1e−3, −logRatio ≥ 5). (E) Candidate FAIRE-STARR enhancers were cloned individually and assessed for enhancer activity by RT-qPCR targeting GFP reporter transcripts (normalized to Rpl19 and Actb). 20 h after transfection, E14 mESCs were treated for 4 h either with LIF, RA or ES medium only (none). Bar plots show normalized mean expression ± SE of three replicates (dots). (F) TF motif-matches identified by JASPAR scan (Supplementary Table S1) for enhancers as indicated were deleted by site-directed mutagenesis and activity was analyzed as described in (E). (G and H) Genomic loci encompassing STARR enhancers selected for genomic deletion using CRISPR/Cas9. Normalized FAIRE-STARR-input, -seq, and RNA-seq signals are shown. RefSeq genes are shown in either black (protein coding genes) or red (non-coding genes). (I and J) Expression of genes (RT-qPCR) near the deleted enhancer and of control genes for clonal wild type (wt) and enhancer heterozygous (E+/−) and homozygous (E−/−) deletion clones. Bar plots represent mean gene expression ± SE of three biological replicates (dots) and 1–3 clonal cell lines (number indicated in brackets) after 4 h of LIF or RA treatment. Data points for individual clonal lines are shown as dots with matching shapes.

