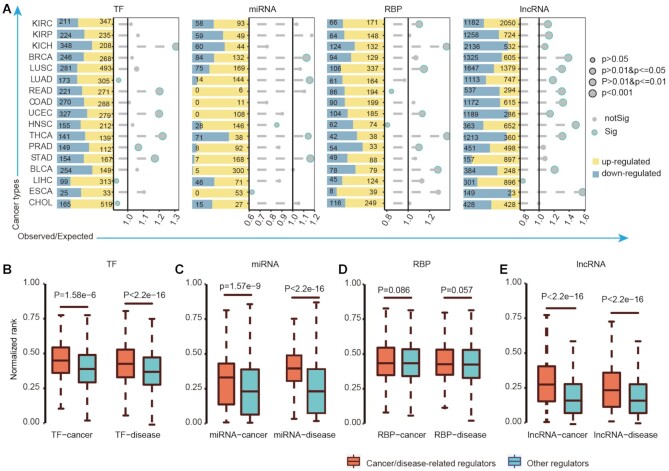
Figure 2.
Dysregulation of immunology regulons across cancer types. (A) The histogram showing the number of significantly differentially expressed genes with FDR <0.001 and |log2FC| >1. The dot plot showing the result of hypergeometric test which evaluated the overlap of immune regulons with differentially expressed genes. The sizes of dots showing the significant levels. The x-axis represents the O/E values. The significant results were with blue frame (P-values < 0.05). (B–E) The normalized ranks of cancer/disease-related regulons (orange) and other genes (blue) which were compared by Wilcoxon's rank-sum tests. (B) for TFs; (C) for miRNAs; (D) for RBPs and (E) for lncRNAs.

