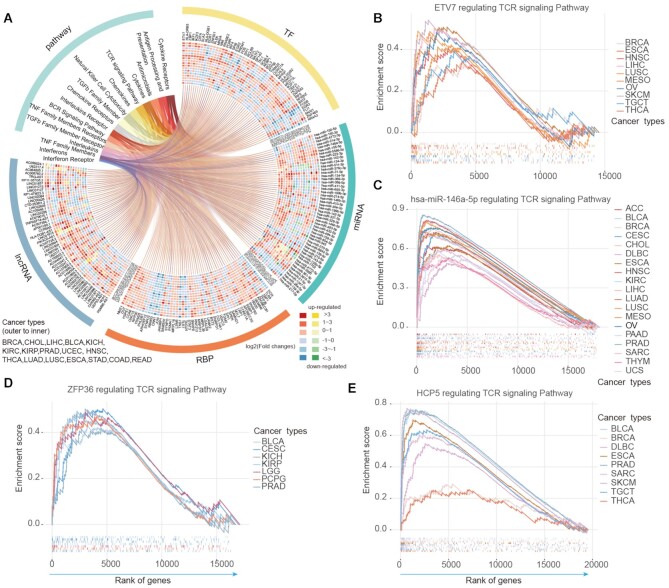
Figure 3.
Top-ranked immunology regulons across cancers. (A) The circos plot showing the top ranked 200 regulons with their enriched pathways across cancer types. For each type of regulons, we showed top 50 and the colored cells represent the corresponding differential expression level of regulons across cancers. Red and yellow representing up-regulation; blue and green representing down-regulation. (B–E) Four examples in circos plot significantly enriched in T cell receptor signaling pathway across cancer types. (B) for TF ETV7; (C) for miRNA hsa-miR-146a-5p; (D) for RBP ZFP36 and (E) for lncRNAs HCP5.

