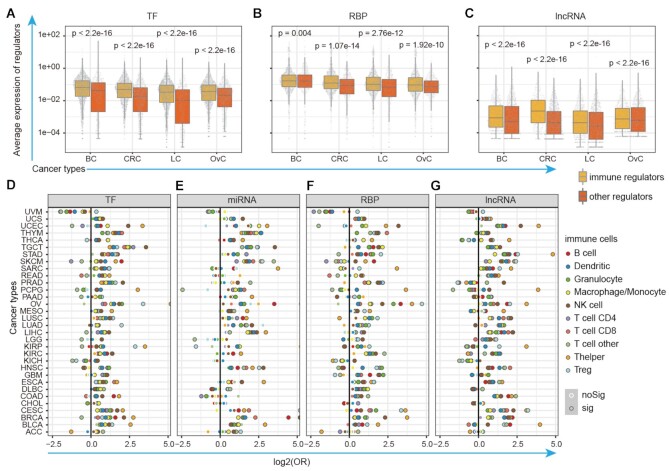
Figure 4.
Immunology regulons exhibit higher expression in immune cell and correlated with immune cell infiltrations. (A–C) Distribution of average expression for immunology regulons and other genes in single immune cells of BC, CRC, LC and OvC. (A) for TFs; (B) for RBPs and (C) for lncRNAs. (D–G) The immunology regulons were likely to be enriched in gene sets that were correlated with immune cell infiltration. The x-axis represents the log-transformed odds ratio (OR) of Fisher's exact tests with diverse color representing diverse types of immune cells. The black-frame dots were with P-values <0.05 in two-sided Fisher's exact test. (D) for TFs; (E) for miRNAs; (F) for RBPs and (G) for lncRNAs.

